IEvoH · Systems analysis
Root causes of the crisis
Our view of the root causes of this crisis is presented on the IEvoH website — an initiative to establish the Institute for the Evolution of Humanity.
Explore the root causesMap
A comprehensive view of how climate change is becoming a global crisis. It is not an isolated environmental problem, but an interconnected system of cascading threats to the global economy, food security, the availability of basic necessities, and society as a whole.
This is not a list of separate risks, but a single self-reinforcing system: impacts occur regularly and across the globe, and are growing in frequency and intensity. They may be interconnected or compound one another's effects. The map reads from top to bottom: the cause triggers a cascade, and each stage places pressure on the next.
The root cause of climate change
The fundamental conditions on which civilisation is built are changing
GHG emissions are rising. Climate change is accelerating.
Climate change thresholds
The planet's response
Natural disasters are becoming more destructive, occurring more often and spreading to new regions previously considered safe. Weather is becoming less predictable. This process is unfolding everywhere, placing pressure on economies and other areas of life. Climate shocks can overlap, significantly compounding damage through their combined effects. All of this is already happening.
Major freshwater sources are gradually deteriorating
Rivers, snow cover, glaciers and groundwaterMore frequent heatwaves and wet-bulb temperatures rising to dangerous levels.
Direct pressure on health and labour productivity.Droughts are becoming more frequent, lasting longer and spreading to new regions.
Soil-moisture and hydrological droughts are becoming chronic.Burned areas are expanding, and smoke is travelling over long distances.
Damage to assets is compounded by a hidden impact on health and incomes.More energy in the atmosphere intensifies extreme precipitation.
Greater strain on urban drainage systems and dams, with a risk of flash flooding.Increasing intensity and frequency.
Threat of severe and widespread physical damage.Sea-level rise and coastal flooding.
Flood risk to coastal cities and assets.Species loss and ecosystem destruction.
These undermine pollination, fisheries, coastal protection and soil fertility.Expansion of the range of disease vectors.
Unfamiliar hazards, new costs.Declining predictability. For example, drought can abruptly give way to flooding.
Makes planning and protection more difficult.Hazards coincide in time and space, or compound one another's impacts.
Heat, drought and fires reinforce one another — a ‘perfect storm’.Risk of irreversible shifts: AMOC circulation, ice sheets and other climate systems.
The probability is low but increasing. The consequences are catastrophic.Impact on the foundations of life and the economy
Rising mortality and morbidity from heat, wildfire smoke and vapours from volatile compounds. Pressure on healthcare systems and insurance reserves.
+2 °CEurope: 70% more people than today — around 172 million per year — will face extreme summer heat. In an average year, mortality from extreme heat will rise by around 75%, to ~52,000 deaths per year.
+3 °CEurope: nearly 300 million people per year — more than half the population. Mortality from extreme heat will increase by a factor of roughly 3, to ~96,000 deaths per year.
Freshwater shortages and rising costs for households, agriculture, industry and data centres.
+2 °C‘Day Zero’ (urban water supplies being cut off) is becoming a recurring risk as early as the 2020–2030s: vulnerable regions include the Mediterranean, southern Africa and parts of North America.
+3 °CThe risk of ‘Day Zero’ becomes chronic and spreads further: India, northern China, North Africa, southern Australia and elsewhere.
Crop losses due to heat, water scarcity and rising water costs → higher prices and shortages.
+2 °CIn key food-producing regions, between 10% and 31% of current production of major crops falls outside its climatic suitability range (South Asia, the Middle East and North Africa, sub-Saharan Africa, South-East Asia, Central America and parts of South America). The range of crops suitable for cultivation narrows across 52% of global cropland. At the same time, the impacts of +2 °C warming could be substantially more severe than the average projection suggests: around a quarter of climate models already project stronger droughts across the world’s key breadbasket regions at +2 °C than the average projection for +4 °C.
+3 °CThe risk increases substantially: between 20% and 48% of current production falls outside its climatic suitability range. In the Middle East and North Africa, South Asia and sub-Saharan Africa, around 60–69% of cropland is at significant risk.
Risk of nuclear and thermal power plant shutdowns due to high water temperatures, as well as reduced hydropower generation → higher prices and the threat of blackouts. At the same time, demand rises due to cooling needs.
+2 °CEurope: hydropower plants and water-cooled thermal and nuclear power plants lose up to 10% of capacity. Losses in France — a key energy exporter — could rise to ~20%.
+3 °CEurope: water-cooled thermal and nuclear power plants lose up to 15%–20% of capacity. Hydropower losses increase substantially — in the Mediterranean, they could double or triple.
Falling water levels in major navigable rivers (the Rhine, Danube, Po and Loire) make freight transport more expensive or bring it to a halt.
+2 °CRhine in summer: average water level −10%, in dry weeks −20%, and in drought years up to −35%. Danube: historically rare low-flow events intensify.
+3 °CRhine in summer: seasonal water level −15–20%, in dry weeks −30–35%, and in extreme periods up to −60%. Danube: extreme low-flow events intensify and water scarcity becomes more frequent.
Reduced production due to water shortages for industrial processes. Rising raw material costs and product prices.
+2 °CMandatory water-use restrictions and downtime in water-dependent industries become more frequent in vulnerable regions.
+3 °CThe number of vulnerable regions is growing, while chronic shortages constrain operations and production growth.
A problem with catastrophic potential. Ecosystems sustain clean water, fertile soils, pollination, food security and protection from extreme weather; businesses depend directly or indirectly on biodiversity [IPBES, 2026IPBES Business and Biodiversity Assessment Summary for Policymakers“Biodiversity and nature's contributions to people underpin the economy, so all businesses depend, directly or indirectly, on biodiversity.”PDF · p. 5; ESOTC, 2025European State of the Climate (ESOTC) 2025“Diverse species and habitats support clean air and water, fertile soils and pollination, contributing to food security, livelihoods and health... regulate the climate and protect against extreme events.”PDF · p. 9].
+2 °C18% of insects, 16% of plants and 8% of vertebrates may lose more than half of their climatically suitable range. Up to 90% of coral reefs may be lost: they support around 25% of marine life, as well as food or incomes for ~500 million people. [Price et al., 2024 / Warren et al., 2018Biodiversity losses associated with global warming of 1.5 to 4 °C“At 2 °C, these projections of loss fall to 18% of insects, 16% of plants and 8% of vertebrates...”Article · review of the assessment by Warren et al., 2018; IFoA, 2026Planetary Solvency: Tipping into the wild unknown“Coral reefs, which support 25% of marine life, are projected to decline by up to 90% by 2050.”“...the food and economic livelihoods of an estimated 500 million people.”PDF · p. 26].
+3 °C 49% of insects, 44% of plants and 26% of vertebrates may lose more than half of their range. Other ecosystems are also at significant risk: rainforests and mangroves may begin to collapse, disrupting water supplies, food systems, coastal protection and regional weather patterns. [Price et al., 2024 / Warren et al., 2018Biodiversity losses associated with global warming of 1.5 to 4 °C“Climatically driven geographic range losses of more than 50% is projected in ~49% of insects, 44% of plants and 26% of vertebrates for warming of 3.2 °C...”Article · review of the assessment by Warren et al., 2018]; HM Government, 2025Global biodiversity loss, ecosystem collapse and national security (2025)“There is a realistic possibility that some ecosystems... start to collapse from 2030, and others (rainforests and mangroves) start to collapse from 2050.”PDF · p. 2; HM Government, 2025Global biodiversity loss, ecosystem collapse and national security (2025)“If current rates of biodiversity loss continue, every critical ecosystem is on a pathway to collapse... including the collapse of major food sources and fundamental changes to global weather patterns.”PDF · p. 7; ESOTC, 2025European State of the Climate (ESOTC) 2025“Diverse species and habitats support clean air and water, fertile soils and pollination, contributing to food security, livelihoods and health... regulate the climate and protect against extreme events.”PDF · p. 9].
Physical risk becomes financial risk and a threat to societal stability
Without insurance, an asset ceases to be acceptable collateral → banks stop lending and buyers stop buying. Mortgages, lending and sales in risk zones grind to a halt.
‘Uninsurable zones’ have already emerged in California, Florida and Greece; more than 2 million US households have lost access to private insurance. [UNU-EHS, 2023UNU-EHS — An uninsurable future? The insurance protection gap and climate change (2023)“certain areas may become effectively ‘uninsurable’ … risk tipping point of uninsurability”; FSF, 2025First Street — 9th National Risk Assessment: The Insurance Issue (2025)“dramatic pullout of coverage across California, Florida, and Louisiana … insurer of last resort … the largest insurer in the state”PDF · p. 5; WWA, 2025World Weather Attribution (2025)“large parts of the country have already been classified as ‘red zones’ by insurers, limiting access to affordable property insurance”PDF · p. 32; Capgemini, 2023Weathering the Climate Change Storm“These catastrophe-induced increases, combined with regulatory constraints that prevent insurers from adjusting prices at pace, lead to more locations becoming uninsurable ... The risk of uninsurability is growing in other regions of the world as well...”PDF · p. 4]Assets in risk zones lose liquidity and value; estimated future losses in the US are up to $1.47 trillion. [FSF, Property Prices in Peril, 2025First Street — Property Prices in Peril: 12th National Risk Assessment (2025)“70,026 neighborhoods (84% of all census tracts) … $1.47 trillion in net property value losses”]
The impact is concentrated in places that continue to attract people and capital.Crop, infrastructure and asset losses translate into commodity price spikes, falling asset values and sell-offs.
Risk chain: commodity price spikes → falling asset values → mass sell-offs → stock-market declines → pension-fund shortfalls → financial crisis. [ Chatham House, 2021Climate Change Risk Assessment 2021“Destabilization of markets”“Commodity price spikes”“Fall of asset prices”“Large-scale asset sell-off”“Falling stock markets”“Underfunded pension funds”“Financial market collapse”PDF · p. 37; Chatham House, 2021Climate Change Risk Assessment 2021 — Economic and trade disruption“Equity markets would also see abrupt shifts...”“...leading to a sell-off of assets, declining equity prices, and shortfalls in pension funds, and ultimately undermining the financial markets...”“...spill over into the real economy.”PDF · p. 41 ]The market only needs to realise that risk has been mispriced: repricing happens suddenly, unevenly and in both directions. [FSB, 2025Financial Stability Board (2025)“A large-scale shift in beliefs or awareness about the economic and financial implications of these risks could cause a significant and abrupt repricing of climate-exposed assets.”“This may result in a sudden re-evaluation of the materiality of climate-related financial risks by market participants.”PDF]
A systemic financial crisis spills over into a global economic crisis — a ‘Minsky moment’.Accumulation of hidden credit losses and rising capital requirements. [BIS, 2025BIS — Incorporating physical climate risks into banks’ credit risk models (2025)“...standard setting bodies and financial regulators have increasingly urged banks to recognise physical climate risk as a new factor in their risk space and internalise it in their credit risk management policies.”“...account for physical risks in banks' capital requirements, loan loss provisions...”“...Model RWA, when physical risk-related corrections are included, increases by around 7.9% [up to 20%] compared to the original calculations...”PDF; FSF, 2025First Street — 13th National Risk Assessment: Climate, the 6th C of Credit (2025)“$1.21 billion in bank losses in 2025 … rise credit losses to $5.36 billion”]
A contraction in credit supply deepens regional downturns.Climate factors weigh on sovereign ratings (≈half of countries by 2050). [Fitch, 2026]Fitch Ratings — Climate Risk to Become Increasingly Important Sovereign Rating Driver (2026)“Around half of Fitch-rated sovereigns have a Climate.VS of 50 or more by 2050 … only 6% have a Climate.VS of 70 in 2050, indicating a potential downgrade of three notches. We see major fossil fuel exporters and small countries in harm’s way of physical risks as the most exposed”
The largest asset class — ~$65 trillion in sovereign debt — is mispriced. [Oxford, 2024Oxford — Impact of physical climate risks on sovereign credit ratings (2024)“mispricing the risk of world’s largest asset class … global sovereign bond market is valued at nearly $65 trillion”]A series of disasters could push budgets to their limits.
Relief and recovery compete with debt servicing.Access to safety is determined by capital: the wealthy retreat to ‘climate havens’.
Vulnerable groups are trapped in depreciating assets; forced migration increases.Falling incomes, resource shortages, rising water and food prices, mass climate migration and growing social inequality increase political instability and social tension.
Food price spikes have historically coincided with waves of protests and uprisings.Political instability and the risks of disputes over resources and armed violence are increasing.
The cascade may include transboundary disputes over water basins, regional conflicts, the growth of extremist groups, organised violence, conflicts between people and the state, civil wars and wars between states. [ IPCC AR6 WGII, Ch. 4IPCC AR6 WGII — Chapter 4: Water"The impact of climate change on shared water resources might increase tensions among states...""Future climatic conditions and population growth are expected to exert additional pressures on managing already stressed basins such as the Nile, the Indus..."ipcc.ch; IPCC AR6 WGII, Ch. 5IPCC AR6 WGII — Chapter 5: Food, Fibre and Other Ecosystem Products"Increasing demands for food, energy and water can lead to domestic and international conflict, including political instability and migration, often in the context of drought.""Rising food prices can affect conflict, political instability and migration..."ipcc.ch; UN-WaterUN-Water — Transboundary Waters"Mismanaged transboundary water supplies have the potential to cause social unrest and spark conflict.""Transboundary waters account for 60 per cent of the world’s freshwater flows. 153 countries have territory within at least one..."unwater.org; World BankWorld Bank — Indus Waters Treaty"The Indus Waters Treaty was signed in 1960 after nine years of negotiations between India and Pakistan with the help of the World Bank...""...it has survived frequent tensions, including conflict..."worldbank.org; Nature Water, 2024Nature Water — Energy trade tempers Nile water conflict"...new electricity trade agreements between Ethiopia, Sudan and Egypt could help resolve the ongoing water dispute over the Grand Ethiopian Renaissance Dam.""The potential impacts... have created political tensions."nature.com; Chatham House, 2021Climate Change Risk Assessment 2021“Armed conflict”“Regional conflicts”“Rise of extremist groups”“Police/military intervention”“Organized crime and violence”“Conflict between people and states”“Civil war and war”PDF · p. 37 ]Likely scenarios
(if current trends continue)
A delayed but abrupt transition to a zero-carbon economy under pressure from disasters.
Rapid devaluation of ‘carbon’ assets (transition risk) and severe regulatory shocks for business. [BIS, 2025BIS — Climate-related risks in sovereign bond pricing (2025)“transition risk is associated with higher sovereign yields”“the effect more pronounced for developing economies and for high-emitting countries after the Paris agreement”“developing countries with higher carbon emissions and a less sustainable growth trajectory will find it more difficult to smoothly transition to a decarbonized economy…”“This will further impact projections for economic growth, fiscal health, and external sector vulnerability…”PDF].A deep and prolonged global economic and social crisis.
Water and food shortages, rising prices, loss of capital, mass migration, multiple conflicts between groups or states, and the inability of vulnerable states to maintain basic functions. Mass mortality from disease, malnutrition, thirst and conflicts in the worst-affected regions [Planetary Solvency, 2025IFoA & University of Exeter — Planetary Solvency: finding our balance with nature (2025)"…the scale and pace of human activity has continued to drive planetary outcomes, with a non-trivial risk of ruin — the loss of prosperity due to severe societal and economic disruption."PDF · p. 8; PIK revised, 2025PIK - The economic commitment of climate change, revised (2025)"permanent income reduction for the majority of regions, including North America and Europe (with median income reductions of approximately 8 and 7% respectively)"].An extreme but likely scenario.
This is not alarmism, but an expert assessment. Timeframe: by 2050 [Planetary Solvency, 2025IFoA & University of Exeter — Planetary Solvency: finding our balance with nature (2025)"…the scale and pace of human activity has continued to drive planetary outcomes, with a non-trivial risk of ruin — the loss of prosperity due to severe societal and economic disruption." (p. 8)"the trajectory is concerning, with Catastrophic to Extreme impacts Likely or Highly Likely by 2050." (p. 27)PDF], but accelerating warming could bring the same climatic conditions sooner (in 2036–2040).Part 1
The fact is acknowledged, but neither the market nor science has the full picture. Purpose of the report. Three reasons why the scale of the problem remains unrecognised.
01.1 Established fact
The scientific consensus is unequivocal. The main causes are the burning of fossil fuels (coal, oil and gas), modern agriculture and other anthropogenic factors.
Transnational corporations, financial institutions, regulators, insurers and consultancy firms recognise the problem. Nevertheless, a comprehensive view of the situation remains rare, and even scientists lack a full understanding of the risks and consequences.
For an investor, the current situation comes down to five facts:
01.2 Purpose and sources
The report aims to translate academic knowledge into plain language. We have brought together disparate research to present a comprehensive picture of what our world may become in the near future. The economy and finance represent only one aspect of this transformation.
The conclusions drawn from the data collected require a major reassessment of core development strategies.
The report provides reliable physical benchmarks (the progression towards the +1.5 °C and +2.0 °C thresholds) and describes their cascading impacts. This evidence base makes it possible to grasp the true scale of the changes ahead and begin adapting today.
The report draws on more than 200 studies by the world's most respected scientists, macroeconomists, banks and asset management firms.
We draw on the latest data from 2024–2026. These studies fundamentally change the risk picture, but some have yet to be incorporated into the cumbersome mainstream models used by major financial institutions.
The report's reliability is underpinned by four types of sources:
01.3 Three problems
Climate change affects the vast majority of natural and economic systems simultaneously. The resulting interconnections and cascading effects are so complex that calculating them precisely is inherently difficult, even for the scientific community.
Because of a lack of understanding of these complex mechanisms, the changes under way remain unnoticed by most people. The issue slips from view, and the true scale and severity of the consequences ahead go unrecognised.
No single forecasting model exists that accounts for all aspects and consequences of climate change. Some models project only the physical climate system (ESM), while others project only the economy (IAM). They exchange static data, but do not influence one another in real time and fail to capture feedback loops.
One example of these connections:
At the same time, the mandatory multi-stage review process for new scientific evidence takes years. It takes even longer for these findings to be incorporated into the core macroeconomic models used by governments and companies. The result is an institutional lag: the global market is forced to assess risks using outdated information, creating a vast ‘blind spot’ across the economy.
Climate scientists are quite literally sounding the alarm, but the public remains passive while politicians and corporations continue to profit, worsening the problem.
Far too little funding is allocated to averting catastrophic scenarios. Even less is allocated to adaptation to impacts that are already being felt. At the same time, tail risks (low-probability but catastrophic events) are often underestimated or not considered at all, even in scientific reports, owing to limited resources or insufficient data for modelling.
Part 2
Broken promises and the +1.5°C threshold · climate change’s ‘hidden tax’ on the economy.
02.1 Broken promises · the +1.5°C reality
In 2015, leaders from almost every country in the world agreed to limit global warming to 1.5°C in order to avoid catastrophic consequences. But those commitments were not met. In 2024, the 1.5°C threshold was temporarily exceeded for the first time, and the latest scientific evidence projects that it will be crossed on a sustained basis as early as 2028. [Kirchengast & Pichler, 2025; WMO, 2025]
02.2 Climate tax · the present
In 2024–2025, key institutions whose findings shape economic and financial forecasting—the US National Bureau of Economic Research (NBER), the Potsdam Institute (PIK), a consortium of central banks from around the world (NGFSA group of central banks and supervisors, including the ECB and the Federal Reserve, established to help green the financial system), Bloomberg and the UN—presented fundamentally new estimates of the economic damage caused by climate change.
If global temperature has substantial economic effects, why did they not become apparent after nearly 1°C of global warming since 1960? Because climate change occurs in small increments, its effects are hidden by background economic variability. Because climate change is also permanent, its effects continue to accumulate over time.
NBER · 2025
Key findings on the current situation:
Chapter
Emissions continue to rise, warming is accelerating, and the actual impacts at the same levels of warming could be substantially more severe than average projections suggest.
02.3 Root cause
Global greenhouse gas (GHG) emissions are not falling—they continue to rise and set records [Climate State in 2024; UNEP, Emissions Gap Report, 2024]. To illustrate the scale of this contradiction: it is as if, instead of using water to extinguish a burning house, we were throwing coal onto the fire—which is almost literally what is happening.
02.4 Pathway to +2°C and +3°C
Decades of ignoring the problem have made it virtually inevitable that, owing to the inertia of the climate system, we will reach the next threshold—2.0°C of warming [Kirchengast & Pichler, 2025; WMO, 2025].
The probability of limiting warming to below 2°C is less than 5% [Rhodium, Climate Outlook, 2025Rhodium — Climate Outlook 2025“the probability of limiting warming below 2°C before the end of the century... remains below 5%”].
The likely period for reaching 2.0°C was identified as 2041–2060 [IPCC AR6, 2023]IPCC AR6 WGI — The Physical Science Basis, SPM (2021). As a result, 2050 became the reference point for many long-term strategies.
Unless urgent action is taken, global temperature will continue to rise, reaching 3.0°C by the end of the century [IPCC AR6, 2023]IPCC AR6 WGI — The Physical Science Basis, SPM (2021).
Risk management must now assume a scenario of 2–3°C warming. The bet that ‘everything will sort itself out’, ‘the market will self-correct’ or ‘governments will keep warming at a safe level’ has failed.
Crucially: the financial world, most international institutions and regulators rely on established estimates that place the +2°C threshold at ~2050 and +3°C at ~2100 (assuming current policies continue), because their calculations are based on conventional, widely accepted climate models. This scenario underpins many assessments of risk and asset values.
However, the latest scientific evidence indicates a sharp acceleration in warming:
Accordingly, in 2025 Germany’s scientific establishment—the societies of physicists (DPG) and meteorologists (DMG)—issued a joint ‘Call for Decisive Action’. The scientists formally report a risk of +3°C being reached as early as 2050, while by 2100 the global temperature increase under current policies could be 4–5°C [ DPG & DMG, 2025 DPG & DMG — Gemeinsamer Klimaaufruf (2025) p. 4: “Bereits bis 2050 besteht das Risiko einer Erwärmung um 3 Grad.” p. 4: “4–5 °C bis 2100 unter den derzeitigen politischen Rahmenbedingungen erwartet.” ].
Also in 2025, NGFSA group of central banks and supervisors, including the ECB and the Federal Reserve, established to help green the financial system (a consortium of central banks from around the world, including the ECB and the Federal Reserve) added a special scenario Current Policies (high climate response). The reason was an acknowledgement that, with the same emissions, climate change could unfold much faster and cause more damage than previously assumed. NGFSA group of central banks and supervisors, including the ECB and the Federal Reserve, established to help green the financial system describes such an outcome as physically plausible (20%) and recommends that regulators take it into account in stress tests. In this scenario, global temperatures reach +2°C in the second half of the 2030s, +2.5°C by 2050 and +3.8°C by 2100. [NGFSA group of central banks and supervisors, including the ECB and the Federal Reserve, established to help green the financial system, 2025NGFSA group of central banks and supervisors, including the ECB and the Federal Reserve, established to help green the financial system — Physical risks in the updated Climate Impact Explorer (2025)p. 6: “we provide data for a physically plausible high-risk future in which the same emissions pathway [...] results in additional 0.9°C.”p. 22: “such an outcome would need to be considered by regulators for physical stress testing purposes.”p. 35, Table 2: high climate response — 2.5°C in 2050 and 3.8°C in 2100.].
‘Prepare for the consequences of faster-than-expected warming’ [Planetary Solvency, 2026Planetary Solvency: Tipping into the wild unknown“Prepare for implications of faster than expected warming”Web].
For the rest of the report, dates given in sources, especially ‘2050/2100’, should be read in light of the possibility of revised timelines. At the same time, specific damage estimates may take into account not only temperature increases but also other indicators; for example, estimates of GDP per capita may reflect the corresponding population growth.
Verifying new scientific evidence and integrating it into the regulatory macro models that guide businesses and the public takes years. As a result, the latest evidence on the acceleration of climate change has not yet been incorporated into the main climate and macrofinancial models used by international institutions and regulators. This means that most financial models and risk assessments based on them may underestimate the speed and scale of the threat: [ NGFS, 2025 NGFS — Physical risks in the updated Climate Impact Explorer (2025) p. 23: The baseline Current Policies scenario uses the median climate response. Stronger warming is presented separately as a plausible “what-if” scenario for physical stress testing. ]:
Status of sources The findings confirm that warming has accelerated since 2015: Foster & Rahmstorf detected this with more than 98% confidence, while Zou et al. found it in every satellite and reanalysis dataset examined. Simple projections indicate a risk of reaching +2.0–2.5°C within the next decade (the studies by Foster & Rahmstorf, Hansen et al. and Kirchengast & Pichler were published in peer-reviewed scientific journals; Zou et al. is still undergoing peer review). [ Foster & Rahmstorf, 2026 Foster & Rahmstorf — Global Warming Has Accelerated Significantly (2026) pp. 4–6: After removing the influence of ENSO, volcanoes and solar activity, the acceleration was detected with more than 98% confidence. p. 6: Global temperature began to diverge from its previous trajectory around 2015. ; Zou et al., 2026 Zou et al. — Global warming acceleration in satellite-observed lower-tropospheric temperature (2026) p. 2: Statistically significant trends after 2015 were found in every satellite and reanalysis dataset. p. 7: By 2034, calculations indicate an additional 0.50–1.04°C of lower-tropospheric warming. The +2.0–2.5°C risk estimate is an interpretation of this projection: the authors did not calculate the exact timing or probability of surface-temperature thresholds being crossed. ].
Average projections conceal a wide range of possible impacts. For droughts across the world’s key breadbasket regions, around a quarter of models project stronger droughts at +2 °C than the average projection for +4 °C. For extreme precipitation and fire weather, the most severe projections at +2 °C exceed the average projections for +3 °C. For fire weather, the highest and lowest estimates at +2 °C differ by more than a factor of four. In other words, higher levels of warming may be reached earlier, while the impacts at those levels could also be substantially more severe [Nature, 2026Bevacqua et al. - Moderate global warming does not rule out extreme global climate outcomes (2026)“For droughts in global key breadbasket regions, precipitation extremes over highly populated areas and fire weather extremes across forests, global climatic impact-drivers at 2 °C of global warming may turn out to be much more extreme than model-averaged projections at 3 °C or 4 °C warming.”“Out of 42 models, 10 models show climate outcomes at a 2 °C warming that are well beyond the multimodel mean at 4 °C of global warming.”“The four worst-case models at a moderate 2 °C warming show an increase in FWI extremes across forests larger than the multimodel mean projection at 3 °C warming...”“...the worst-case model showing an increase more than 4-times larger than the best-case model (+6.5 against +1.5 relative to preindustrial conditions...)”].
Even protection that is technically achievable can become impossible when there is no time left to put it in place.
Part 3
What +2 °C means in physical and economic terms: nonlinear damage, the accumulation effect, the climate tax of the future — and why it is already inevitable.
03.1 Physics of the +2 °C scenario
A 2°C rise is not much—unless we are talking about your body temperature or the planet’s. Even a small increase in global temperature causes a nonlinear increase in the frequency and intensity of extreme events. In other words, warming from 1.5°C to 2.0°C will bring more risks than warming from 1.0°C to 1.5°C [IPCC AR6, 2023].
This is a shift to a climate regime similar to that of the early Pliocene, which the planet has not experienced for more than 3 million years [Hansen et al., 2025]. Natural ecosystems, agriculture and infrastructure are not adapted to such conditions. Many organisms cannot adapt to such rapid changes—doing so takes thousands of years of evolution.
This is what that world will look like:
03.2 Physical risks → financial risks
A 2°C rise poses a direct threat to global economic stability.
At the current level of technological development, there is a high risk of a food and water crisis that will affect every country to some degree [GlaMBIE Team, 2025; IPCC; Heikonen et al., Nature Food, 2025].
The world’s leading financial and scientific institutions warn that insurance markets could collapse in vulnerable parts of the world and that the financial system as a whole could be destabilised [Allianz, 2025Allianz — Rethinking climate adaptation for global resilience (2025)“certain assets effectively uninsurable”; First Street Foundation, 2025First Street — 9th National Risk Assessment: The Insurance Issue (2025)“private insurance companies are effectively labeling areas as uninsurable; property values will deflate”; EEA, 2024].
Infrastructure: Dams designed for a ‘100-year flood’ can withstand a modest increase in heavy rainfall. But once a certain threshold is crossed, they are breached, and damage increases not by 10% but severalfold.
Agriculture: Up to a certain threshold, heat reduces crop yields gradually; once it is exceeded, losses rise disproportionately, rapidly reducing the resulting harvest.
Labour productivity: Up to a certain threshold, heat merely slows people down. Beyond it, working becomes unsafe: at a wet-bulb temperature of around 31°C, overheating can begin after just 60–90 minutes of moderate exertion [Penn State University ResearchPenn State — Humans can't endure temperatures and humidities as high as previously thought (2022)“actual maximum wet-bulb temperature is lower — about 31°C wet-bulb”; Raymond, C. et al., 2020Raymond et al. — The emergence of heat and humidity too severe for human tolerance (2020)“...a wet-bulb temperature (TW) of 35°C marks our upper physiological limit, and much lower values have serious health and productivity impacts… an upperlimit for survivability under sustained exposure, even with idealizedconditions of perfect health, total inactivity, full shade, absence ofclothing, and unlimited drinking water (9, 10)... severe mortality andmorbidity impacts typically occur at much lower values—for example, regions affected by the deadly 2003 European and 2010 Russian heatwaves experienced TW values no greater than 28°C (fig. S1). In theliterature to date, there have been no observational reports of TW exceeding 35°C and few reports exceeding 33°C (9, 11, 14, 15). ”] Productivity drops not by 5% but severalfold—or, in some sectors, work stops altogether.
A single shock: A country can cope with one major flood by drawing on reserves and borrowing.
A series of shocks: if a megadrought strikes two years later and a hurricane another year after that, the country may lack both the financial and material resources needed for recovery. Each successive shock causes more damage because it strikes an already weakened system. Models from NGFSA group of central banks and supervisors, including the ECB and the Federal Reserve, established to help green the financial system show that damage from a single shock can affect the economy for up to 10 years.
As the planet warms, we move ever closer to thresholds beyond which infrastructure, agricultural and economic systems begin not merely to ‘falter’ but to break down.
03.3 Climate tax · forecast for +2 °C and +3 °C
Looking ahead, the slowdown in growth at warming levels of +2 °C and +3 °C will become even more pronounced:
Losses in potential global GDP per capita.
[NBER, 2025; PIK revised version, 2025; NGFS]
Additional losses of tens of per cent of global GDP are no longer an ‘environmental adjustment’, but one of the largest structural factors within the time horizon of current portfolios. Long-term forecasts of growth, equity returns and sovereign debt sustainability that fail to account for this factor are systematically overstated.
Important considerations:
The actual losses to the economy could be substantially higher.
03.4 A new landscape for investors
The global economy is already locked into a 17% reduction in income (with warming to +2 °C) because of historical carbon emissions and socioeconomic inertia [PIK revised version, 2025].
The question is no longer whether there will be a crisis, but how deep it will be and how to prepare for it.
This is not a conspiracy theory, but the consensus view held by the overwhelming majority of leading experts. This is not alarmism, but a conservative forecast.
Earth scientists and climate scientists are seriously nervous…
Johan Rockström · Director of the Potsdam Institute for Climate Impact Research (PIK) · source — TED Talks (video)
And, no less importantly for investors, this is a scenario that the world’s largest financial and insurance institutions are already incorporating into their business models (see the Finance section).
Chapter
Since 1990, almost every risk indicator has worsened. Weather claims lives, reduces people's capacity to work and undermines food security.
Global impacts of heat and loss of quality of life
In recent years, Europe has experienced several periods of extreme heat and drought, most notably in 2003, 2007, 2018, 2019, 2022 and 2023. The European temperature record of 48.8 °C was set in Sicily in August 2021; in July 2019, Paris reached 42.6 °C and, in light of the trend, began preparing for possible 50 °C days by mid-century [EEA, EUCRA, 2024EEA — European Climate Risk Assessment, EUCRA (2024)PDF · Ch. 11; Prior, 2023; Cazi & Garric, 2023]. In June 2026, new all-time national temperature records were set: Germany — 41.8 °C, Poland — 40.5 °C, Denmark — 37.0 °C [ZDF / DWD, 2026ZDFheute — Wetter: Diese Hitzerekorde sind 2026 bereits gefallen“Jetzt hat der Deutsche Wetterdienst die technische Qualitätskontrolle der zunächst vorläufigen Rekordmessungen abgeschlossen. In dem Prozess ist nicht nur der Hitzerekord noch einmal nach oben korrigiert worden - auf 41,8 Grad in Möckern-Drewitz in Sachsen-Anhalt.”Web; IMGW, 2026IMGW-PIB — Charakterystyka wybranych elementów klimatu w Polsce w czerwcu 2026 roku“Najwyższą wartość temperatury powietrza (40,5°C) odnotowano 28 czerwca w Słubicach... Jednocześnie jest to najwyższa temperatura powietrza zarejestrowana na stacjach synoptycznych w historii pomiarów w Polsce.”Web; DMI, 2026DMI — Varme og uvejr: Ny dansk varmerekord sat i både Ødum og Odense“Vi har fået en ny varmerekord for den absolut højeste temperatur målt i Danmark. I dag blev der målt 37,0 grader...”Web].
At the same time, Europe remains poorly adapted to extreme heat: in 2022, only about 19% of households had air conditioning, compared with 76% in North America [WRI, 2026World Resources Institute — Europe’s Soaring Heat and the Great Air Conditioning Dilemma“The share of households with air-conditioning units by region in 2022 reveals that Europe (19%) lagged behind other regions, particularly North America (76%)...”Web].
European population at risk of extreme heat, people per year
Danger arises when high temperatures combine with high humidity. Sweat no longer evaporates properly, and the body loses its principal cooling mechanism. At as little as a wet-bulb temperature of 30–31 °C even a young, healthy person may no longer be able to maintain a stable body temperature. With moderate physical activity, a dangerous rise in core body temperature may begin within 60–90 minutes — at this level, activity can no longer be continued safely. Once the thermoregulatory limit is exceeded, core body temperature may rise by approximately 0.74–0.93 °C per hour even with minimal activity or light walking.
Shade, water and rest reduce the strain but do not eliminate the problem: if the body can no longer dissipate heat on its own, active cooling, such as air conditioning, is required. Otherwise, body temperature will continue to rise and the person may develop heatstroke — a condition that requires emergency treatment and can be fatal. The risk is higher for older people, children and people with chronic illnesses, and the dangerous threshold may be lower; as their condition worsens, people may no longer be able to assess it accurately because of weakness, dizziness or confusion. [Penn State, 2022Penn State (2022)“the actual maximum wet-bulb temperature is lower — about 31°C wet-bulb…”“critical wet-bulb temperatures ranged … from 30°C to 31°C…”“even for young, healthy subjects”“a person’s sweat will not evaporate at that skin temperature.”“they could no longer adequately regulate their body temperature…”“Older people, people on medications, and other vulnerable populations will likely have a tolerance limit below that.”; Georgia Tech Urban Climate LabGeorgia Tech Urban Climate Lab“a wet bulb temperature of 87°F … is found to induce a fever within 60-90 minutes of exposure at a moderate activity level”“the 87°F threshold at which outdoor activities cannot be safely continued.”“outdoor activities such as landscaping, construction, municipal services … and athletic events would pose an acute health risk and should be discontinued.”; Cottle et al., 2022Cottle et al., 2022 (Journal of Applied Physiology)“uncompensable … heat stress … WH: MinAct, 0.74, LightAmb, 0.87; HD: MinAct, 0.71, LightAmb, 0.93°C/h”“can be used to estimate the time to reach a target core temperature…”; CDC, 2026CDC, NIOSH — Heat-related Illnesses“Heat stroke is the most serious heat-related illness.”“body temperature can rise to 106°F or higher within 10 to 15 minutes.”“Heat stroke can cause permanent disability or death…”“Symptoms of heat stroke include: Confusion, altered mental status, slurred speech”“Loss of consciousness”; CDC, 2024CDC — Heat and Health“People aged 65 years or older are at higher risk for heat-related illness.”“Infants and children are more sensitive to heat…”“People with chronic medical conditions are more likely to have a serious health problem during a heat wave…”]
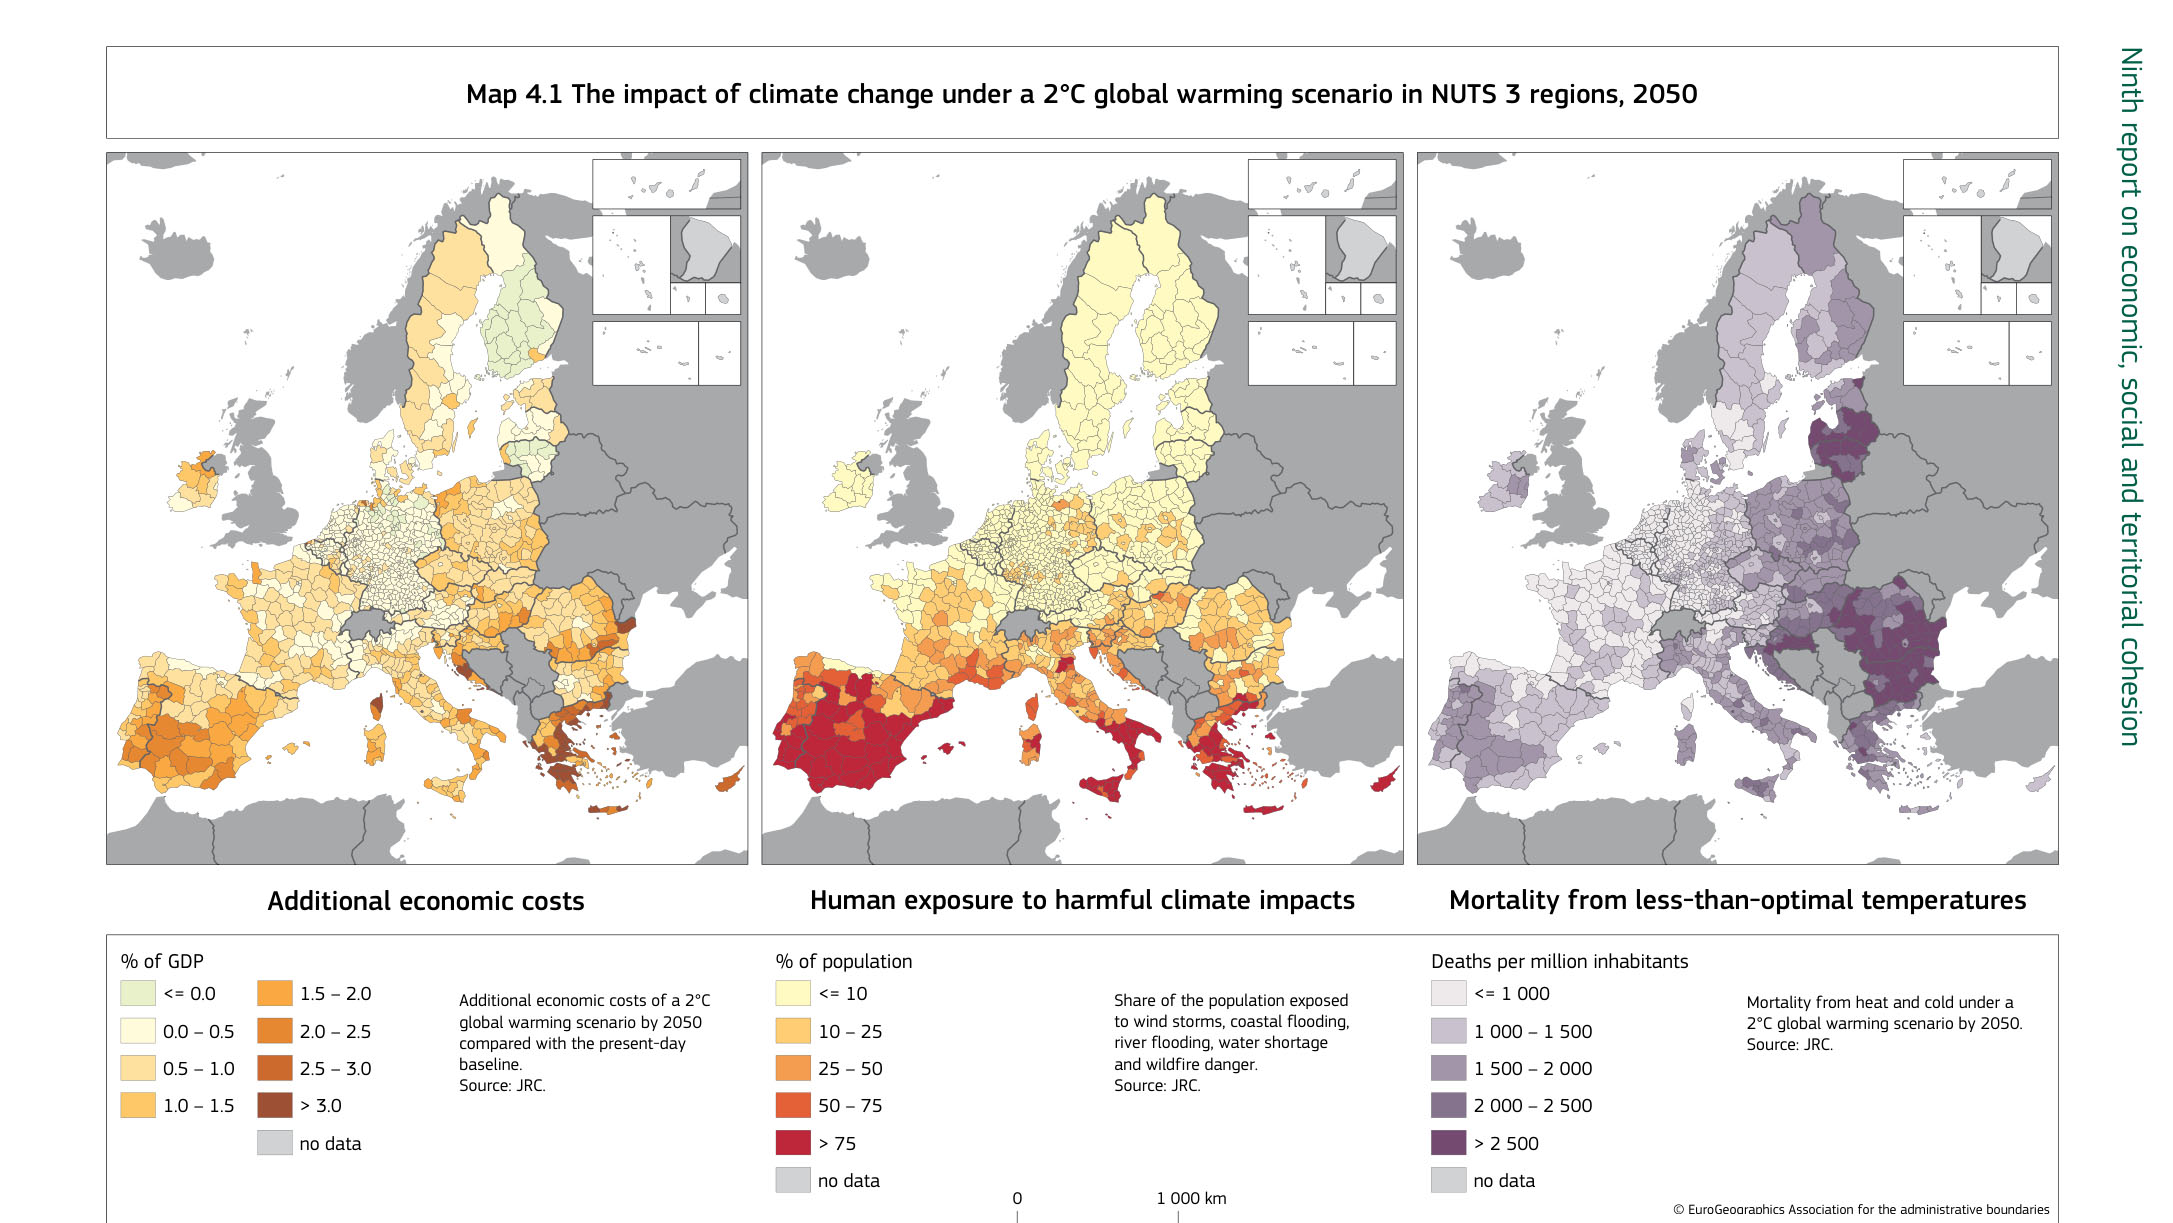
Heat reduces working hours and labour productivity, especially in sectors involving outdoor work. Adaptation measures are critical to worker safety and productivity [van Daalen et al., 2022; EEA, 2022].
In 2024, heat stress caused a record 640 billion potential working hours to be lost (+98% compared with the 1990s), pushing global income losses above $1 trillion for the first time. The agricultural sector bore the brunt, accounting for 63.5% of the time lost [Lancet Countdown, 2025The 2025 report of the Lancet Countdown on health and climate change“globally, 640 billion potential work hours were lost due to heat exposure in 2024... a record-high global potential loss of income worth $1·09 trillion.”PDF · p. 12].
At +3 °C of global warming, labour productivity is expected to fall by 33% in Africa's outdoor sectors and by 25% in Asia. By 2060, indirect effects transmitted through global supply chains will account for 12% to 43% of global economic losses from heat [10NICS, 202510 New Insights in Climate Science 2024/2025“3°C of warming would cut labour effectiveness by 33% in Africa's outdoor, high-exposure sectors and 25% in Asia's... indirect effects on global trade and supply chains are projected to account for 12–43%.”PDF · p. 32].
The combination of wildfire smoke and volatile substances evaporating from scorching asphalt in hot weather worsens air quality.
In Europe, air pollution is the ‘leading environmental health risk’: in 2020 alone, it caused 253,000 premature deaths. Almost 96% of the urban population breathes air that does not meet the latest WHO guidelines [JRC].
Health and biological risks
Dengue fever — an acute viral disease that is transmitted to humans through the bites of infected mosquitoes and can be fatal. It was previously confined to the tropics and subtropics.
Warming is expanding the range of disease vectors: around half of the world's population is now at risk of dengue fever. The largest global outbreak on record occurred in 2024, with 14.2 million cases. [10NICS, 202510 New Insights in Climate Science 2024/2025“Dengue fever surged over the past two years to 14.2 million reported cases in 2024, the largest global outbreak ever recorded... About half of the world's population is now at risk of dengue.”PDF · p. 29].
Climate suitability for transmission of the virus by the mosquito Aedes albopictus has increased by 48.5% compared with the 1950s [Lancet Countdown, 2025The 2025 report of the Lancet Countdown on health and climate change“The estimated global average R0 for Ae albopictus and Ae aegypti mosquitoes increased 48·5% and 11·6%.”PDF · p. 16]. Climate change caused up to 40% of new dengue cases in several countries in the Americas [10NICS, 202510 New Insights in Climate Science 2024/2025“A recent study suggested climate change was responsible for up to 40% of dengue cases in some countries in the Americas.”PDF · p. 30].
Mortality figures are the end point, reflecting the far broader impact of heat on health, particularly for children and older people. Labour productivity is hit hardest in outdoor work (agriculture, construction, street trading and public utilities), as well as in regions where air-conditioning coverage is low — as it is in Europe, for example.
Healthcare costs, recurring cooling costs and infrastructure wear will rise.
Chapter
04.2 Water and drought
A single diagram is enough to understand the risks to rivers, glaciers and groundwater. Fresh water comes from two main sources: surface water (rivers and lakes) and groundwater.
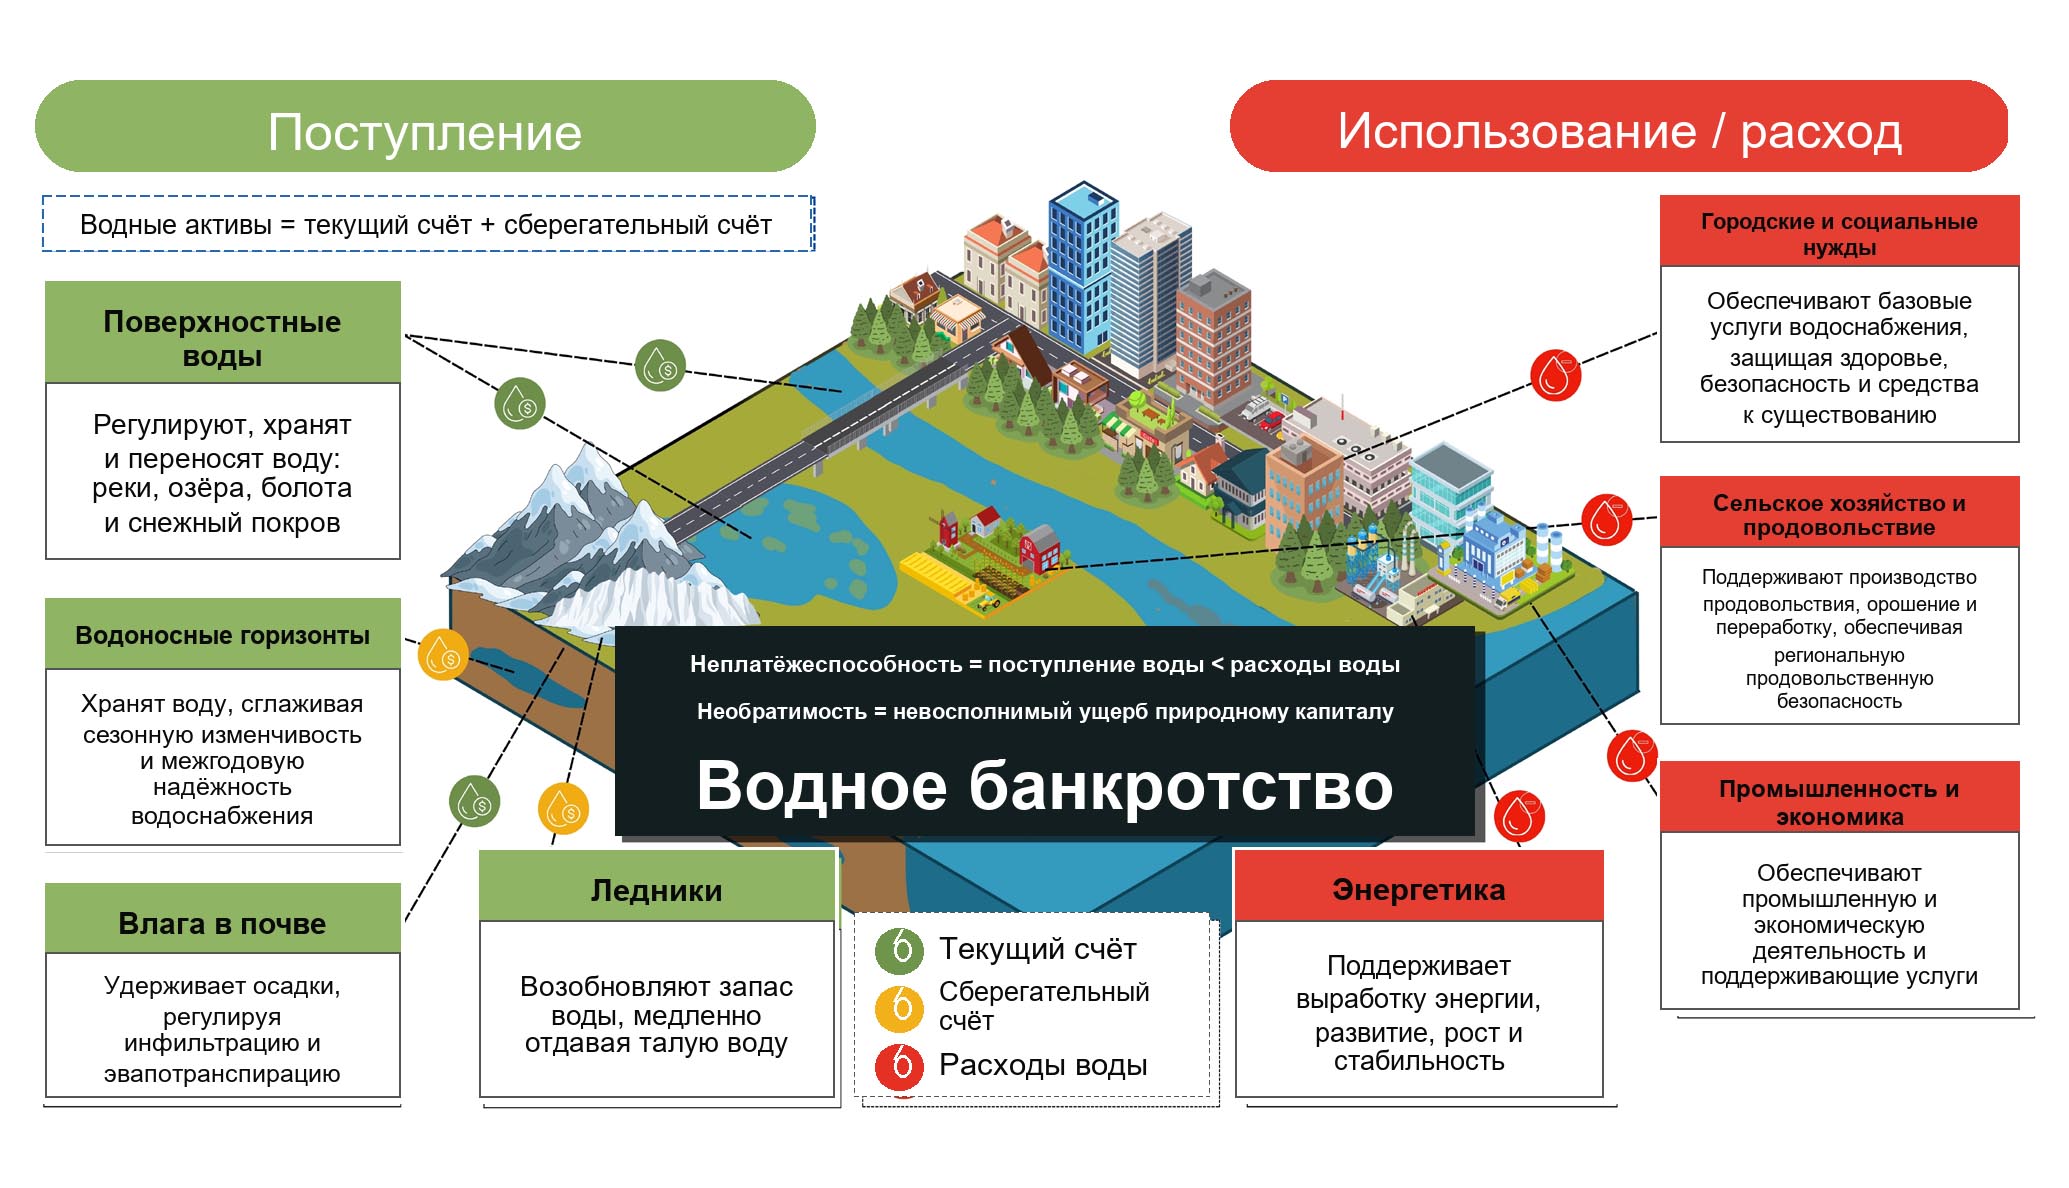
Rivers and lakes are replenished in three ways:
Groundwater (subsurface water) is replenished in two ways:
Cities usually draw on all these sources at the same time, where available.
Around 75% of the world's population lives in 101 countries that are losing fresh water. Satellites are recording an unprecedented loss in the total mass of continental fresh water (including groundwater, soil moisture, snow and surface water). The world's dry regions are drying faster than wet regions are becoming wetter, and the area of arid land is expanding rapidly [«Unprecedented continental drying…», Science Advances, 2025].
For the first time ever, the European Commission has called on Member States to cut water consumption by 10% by 2030 — a direct signal of systemic water scarcity [European Commission, 2025European Commission — European Water Resilience Strategy, 3 June 2025It sets an objective to improve water efficiency in the EU by at least 10% until 2030 and recommends Member States to set their own targets…eea.europa.eu].
Pressure on water resources will intensify, with Southern Europe facing severe water stress. Water scarcity is increasing competition between economic sectors... Europe's water management is poorly adapted to these rapid changes, threatening long-term sustainability... Europe will face more frequent droughts, floods and sea-level rise, as well as complex climate risks. Prolonged droughts will become more frequent, exacerbating water stress and harming society, the economy and ecosystems [EEA, 2025EEA Thematic Briefing“Pressure on water resources will increase, with southern Europe facing severe water stress. Insufficient water resources intensify competition across economic sectors... Europe’s water management is poorly-adapted to this rapid change, compromising longer-term resilience... Europe will face more frequent droughts, floods and rising sea levels, as well as compound climatic risks. Prolonged droughts will become more common, worsening water stress and impacting society, the economy and ecosystems.”eea.europa.eu].
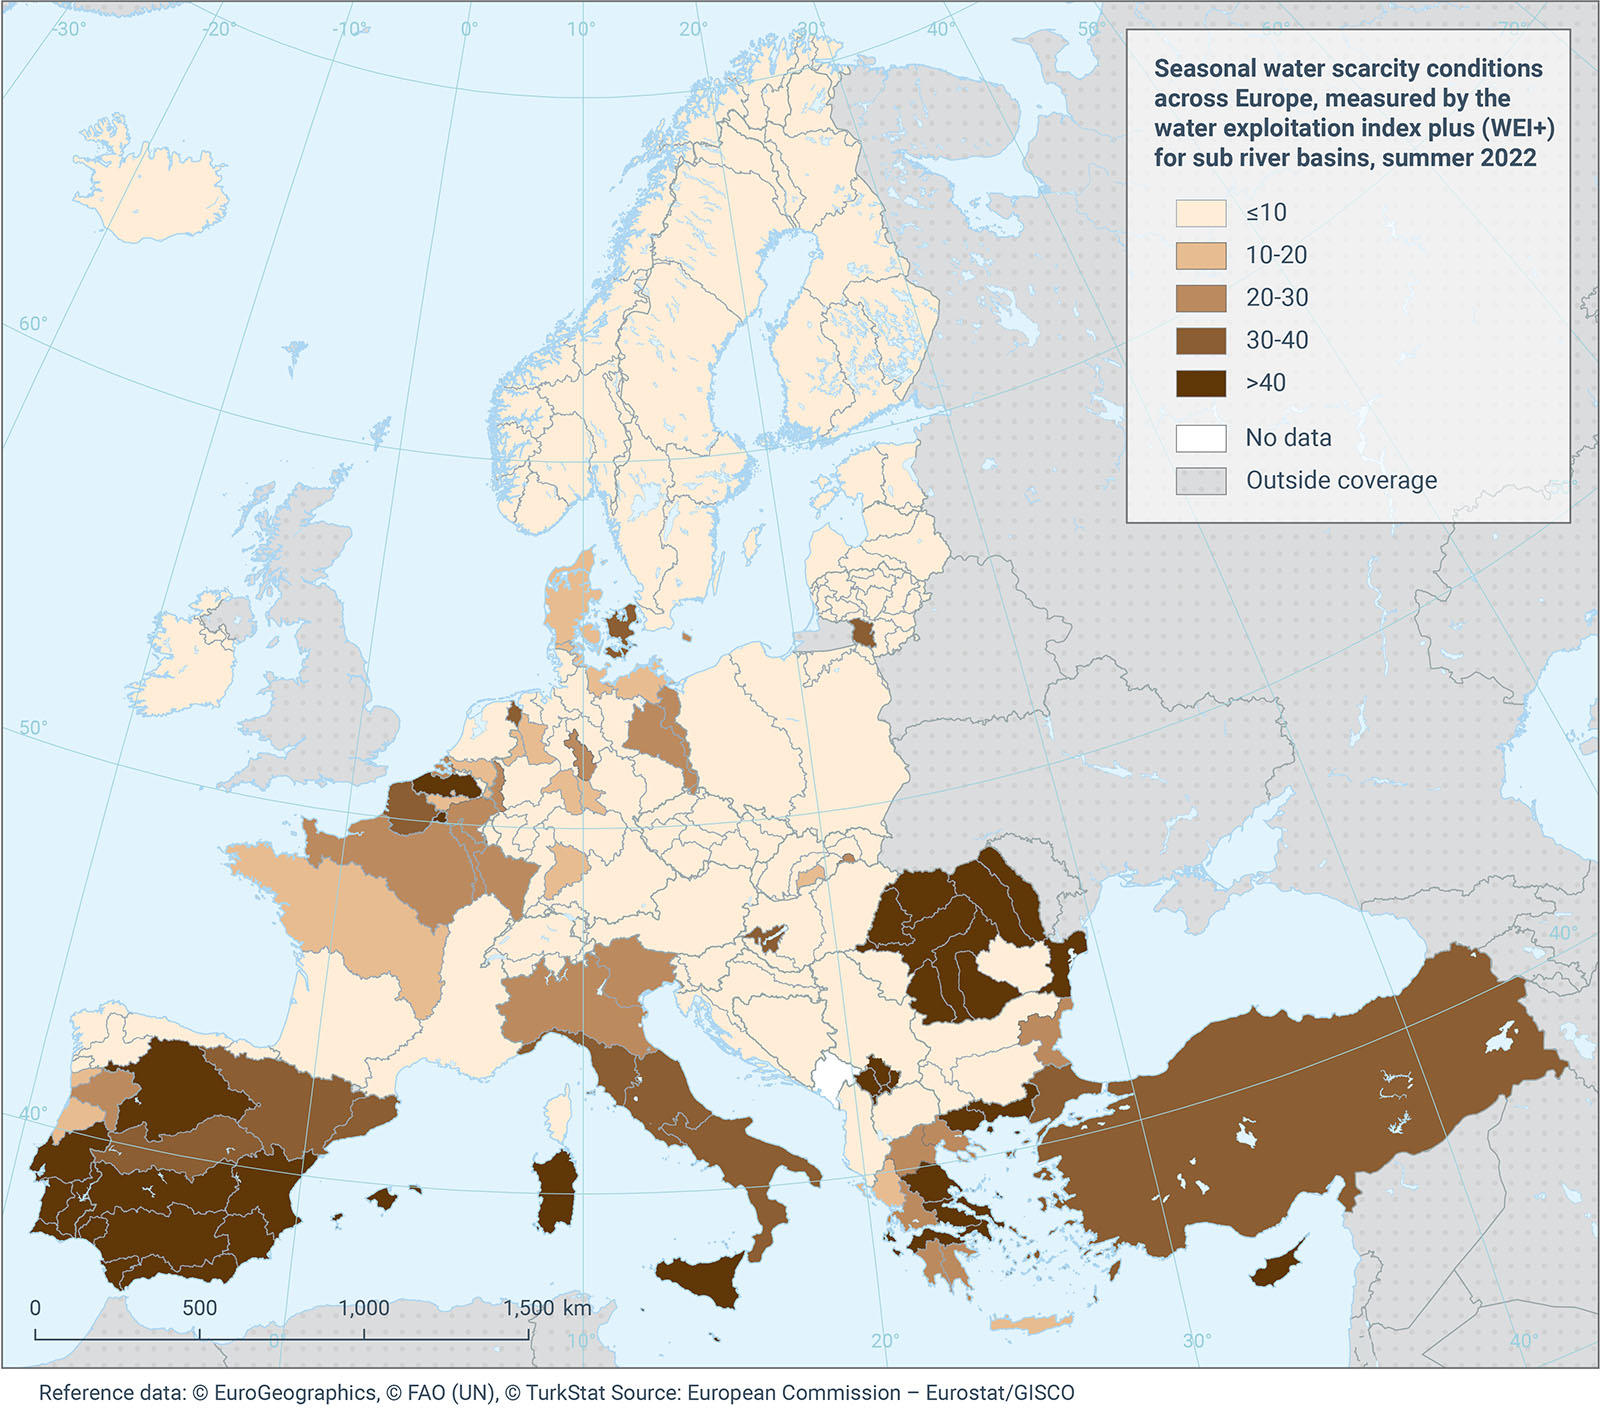
This is not simply a decline in water availability — it is the breakdown of the entire hydrological system. The world faces a growing threat of catastrophic disruption to water resources, undermining the prospect of a sustainable future for all.
04.2.1 The baseline and the shift in the drought regime
In 2024, an area covering 60% of the world's river catchments deviated from normal — it was either too dry or carried too much water. Over the past six years, only one-third of river flows were classified as ‘normal’. The data indicate persistent disruption to the volume and distribution of surface fresh water [WMO, State of Global Water Resources, 2024–2025].
The hydrological ‘normal’ is ceasing to exist as a reference point: only one-third of the territory behaves ‘as before’, while two-thirds show anomalies. Risk models, insurance pricing, infrastructure design and agribusiness based on the ‘normal’ of past years all systematically underestimate risk.
04.2.2 Source 1 · rivers: falling water levels
European water security has been undermined at every level: the amount of available water is declining, its quality is deteriorating and demand continues to grow [EEA, EUCRA, 2024EEA — European Climate Risk Assessment, EUCRA (2024)]. The first source — rivers — is already drying up.
Water stress in Europe: population and river flows
[EEA, EUCRA, Ch. 5, p. 129; JRC]
The situation in the Amazon and the La Plata basin is a warning to the entire world [WMO, State of Global Water, 2025].
A single country faced both historic lows in its rivers (halting grain and ore logistics) and historic highs in flooding (destroying infrastructure). The economy is torn apart by shocks moving in opposite directions: some regions are paralysed by low water, while others are flooded.
04.2.2.1 Logistics chains
The Rhine is the main water artery of Europe’s industrial core. It connects Switzerland, France, Germany, the Netherlands, Belgium and Liechtenstein to the North Sea and the Port of Rotterdam, which handles a substantial share of Europe’s imports and exports. In particular, around 80% of Germany’s domestic inland water freight traffic moves on the Rhine. [Destatis, 2022German Federal Statistical Office — Inland waterways transport“Most of that freight (86.3%, or 71.1 million tonnes) was carried completely or partly on Germany’s most important inland waterway, the river Rhine.”Web] Low water on the Rhine therefore affects logistics, energy and industry across several countries.
Problem: shrinking Alpine snow and glaciers reduce the Rhine’s summer flow. At the same time, rising air temperatures increase evaporation, while earlier snowmelt reduces the amount of water available for summer. [Deltares, 2026Deltares — 17 questions about drought and low water levels in the Rhine and Meuse“A relatively warm spring: the non-permanent snow melted earlier than usual. Evaporation was also higher than in other years.”Web]
2018 — a record low water level was set. Navigation on the Rhine was disrupted for 132 days. Companies in the chemical, steel, paper, metals, construction materials, agriculture and petroleum-products sectors were affected. This event alone cost Germany 0.4% of GDP. [EEA, EUCRA, 2024EEA — European Climate Risk Assessment, EUCRA (2024) / JRC Atlas]
However, 132 days of disrupted navigation did not mean 132 days of a complete shutdown. In 2018, the most severe phase of the shutdown lasted around 20 days. Modelling shows that even today, in worst-case scenarios, a shutdown could last up to 130 days, while periods of reduced vessel loading could reach 200 days per year [Campoverde et al., 2025]. Vessels are also in short supply: “we are fully booked,” carriers report [DW, 2022].
BASF case (Ludwigshafen)
Around 40% of supplies to the world’s largest chemical company normally move along the Rhine. Before the 2018 crisis, 5–10 cargo vessels supplied the site every day. When water levels fell, BASF was able to replace only around one-third of the lost shipping capacity with pipelines, trucks and rail. Fully replacing barges would require an additional 1,600 trucks a day — not a viable option [DW, 2022].
2022 — the 2018 record was broken. Barges could carry only 30–40% of their normal loads, while freight rates rose more than fivefold, again hitting Germany’s GDP. Other major rivers, including the Po and Loire, also fell to very low levels. [EEA, EUCRA, 2024EEA — European Climate Risk Assessment, EUCRA (2024) / JRC Atlas]
2026 — the 2022 record was broken. In July, Rhine flow was about 67% below normal. In many locations, vessels could carry only 20–30% of their normal loads, while at one of the largest inland ports they could carry around one-third. Rates for transporting petroleum products exceeded the previous 2022 record by 54%. In the Netherlands, ferry routes, some locks and harbours were closed. [Reuters, 2026Reuters — Low water hampers Rhine river shipping in Germany, transport costs rise“Vessels are often able to sail only 20% full, with loads having to be divided among several ships.”Web · 13 July 2026 / Straits Times, 2026The Straits Times — Low water on Germany’s Rhine river threatens new blow to economy“vessel loading capacities have dropped to about one-third of their usual levels.”“prices hitting €200 ... previous record of €130 a tonne set in August 2022”Web · 6 August 2026 / DutchNews, 2026DutchNews — Dutch houseboat owners left high and dry by falling river levels“The Rhine sank to its lowest recorded level ... while the flow in the river is one-third of its normal level for July...”Web · 6 August 2026 / DutchNews, 2026DutchNews — Ferries cancelled as rivers drop to record low levels in drought“Restrictions have also been imposed on river barges ... sluice gates have been closed or limited to a few openings a day...”Web · 3 August 2026]
Major rivers — vital transport arteries and sources of freshwater — are becoming systemically vulnerable.
The successive record lows of 2018, 2022 and 2026 call existing projections of future Rhine water levels into question.
Decline in water level relative to the baseline
[Deltares, 2023; ICPR, 2024; Campoverde et al., 2025]
04.2.3 Source 2 · glaciers and snow
Natural freshwater reservoirs that feed rivers in summer are disappearing at a record pace — faster than previously expected — and their loss is irreversible over investment horizons. For the third consecutive year, all 19 glacier regions worldwide are losing mass; for most regions, the point of no return — ‘peak water’ — has already been passed [WMO, State of Global Water Resources, 2024].
Glacier mass loss: world / Alps
[Zekollari et al., Science, 2025]
In the coming decades, the key source of summer water for the Rhine, Rhône, Po and Danube will effectively cease to exist. This means a structural decline in summer river levels, threatening urban water supplies, production, shipping, nuclear-plant cooling, hydropower generation and agriculture in the EU's industrial heartland.
04.2.4 Source 3 · groundwater: depletion
More than one-third of the planet's aquifers are being depleted rapidly [Richey et al., Water Resources Research]. Groundwater depletion accounts for 68% of the total loss of fresh water from non-glaciated continental regions [«Unprecedented continental drying…», Science Advances, 2025]. Groundwater is already being depleted by excessive pumping, especially in Southern Europe. In future, this shortage will spread across almost all of Europe [EEA, EUCRA, 2024EEA — European Climate Risk Assessment, EUCRA (2024); JRC].
Groundwater reserves take decades or centuries to replenish — their loss is effectively irreversible within an investment horizon. Dependence is enormous: half of the world's population obtains its drinking water from groundwater, which also supports around 40% of irrigated agriculture [UN World Water Development Report, 2022].
As groundwater is depleted, its level falls. Most wells in a given region are drilled to roughly the same depth — down to the first aquifer — so hundreds or thousands of wells may stop working almost simultaneously as the level falls [World Drought Atlas, 2024]. Drilling deeper is difficult, expensive and slow: costs and energy requirements rise exponentially, and every additional metre makes the task harder.
Excessive pumping is not the only problem: more than 80% of aquifers where the decline is accelerating have also experienced less precipitation over the past 40 years. The ‘hotspots’ of decline are precisely the regions critical to global food security: Spain (the Guadiana basin), the United States (California's Central Valley and the southern Great Plains), Iran, the North China Plain and the Indus Basin [«Rapid groundwater decline and some cases of recovery in aquifers globally», Nature, 2024].
The depletion of strategic freshwater reserves is a large-scale (affecting more than one-third of all aquifers) and accelerating (deteriorating rapidly in one case in ten) global process. It is occurring in the world's most important agricultural regions, creating a direct threat to global food security and associated financial risks.
No one knows exactly how much water remains in groundwater aquifers, and this ‘severely limits the ability to assess the sustainability’ of their use. ‘The volume of usable global groundwater reserves is largely unknown’; ‘in most cases, we do not know how much groundwater is held in storage’ [Uncertainty in global groundwater storage estimates in a Total Groundwater Stress framework, 2015; Reinecke et al., 2023].
It is as if you did not know how much money was in your wallet but were forced to spend it.
04.2.5 Salinisation · warming · demand · conclusions
Sea-level rise and groundwater depletion lead to saltwater intrusion in coastal regions. This process makes drinking-water sources unusable without costly, energy-intensive desalination.[EEA, EUCRA, 2024EEA — European Climate Risk Assessment, EUCRA (2024)].
Some of the remaining water is becoming warmer and dirtier. Heavier downpours and floods wash fertilisers, wastewater and other substances off fields, increasing the cost of water treatment. This also triggers toxic algal blooms (eutrophication), creating risks to public health (toxins), tourism (unsafe bathing), fisheries (fish kills), industry and agriculture.
In Southern Europe, water withdrawals for cities have risen by 20% over recent decades, and withdrawals for agriculture by 8%. Continued warming and development will drive further increases, creating direct competition for an increasingly scarce resource [EEA, EUCRA, 2024EEA — European Climate Risk Assessment, EUCRA (2024)].
Structure of water use and risks to the largest users
[EEA, EUCRA, 2024EEA — European Climate Risk Assessment, EUCRA (2024); JRC Atlas]
The problem is global and unprecedented — a systemic shift in the global water cycle. Because its main drivers are the depletion of groundwater and glaciers, which take centuries to recover, this represents an irreversible loss of natural capital.
For Europe, there is less fresh water, and what remains is dirtier and warmer. The era of ‘cheap water’ is ending; there will be less water with every passing year — not ‘in 1,000 years’, but now.
04.2.6 Another consequence · land subsidence
Land subsidence, caused primarily by groundwater extraction, is a large-scale and underappreciated risk to cities. In 28 of the largest US cities, at least 20% of the land is sinking, affecting ~34 million people; the process poses a direct threat of structural damage to tens of thousands of buildings and critically exacerbates flood risks [«Land subsidence risk to infrastructure in US metropolises», Nature Cities, 2025].
This is a silent, ‘latent’ risk: infrastructure may be imperceptibly compromised over many years, while the damage becomes apparent only once it is already serious or catastrophic. These are hidden liabilities accumulating on asset owners' balance sheets.
Beyond the direct risk of flooding, real-estate and infrastructure investors must account for the risk of structural damage from land subsidence. Water risk has two faces: groundwater depletion creates both a risk of resource scarcity and a risk of physical destruction of assets at the surface; the two must be assessed together. For coastal megacities such as New York and Houston, this is a double blow: the land is sinking to meet the rising sea.
04.2.7 ‘Day Zero’ case studies
‘Day Zero’ — the term for the day on which the authorities shut off the water supply because of a shortage. In recent years, Cape Town (South Africa, 2018), Chennai (India, 2019), São Paulo (Brazil, 2015), Barcelona (Spain, 2021–2024) and Tehran (Iran, 2025–2026) have faced this reality.
‘Day Zero’ is becoming a recurring risk in some regions as early as the 2020s and 2030s. Even quadrupling the length of time for which reservoirs can sustain water supplies during a drought helps in only 8% of cases [Ravinandrasana & Franzke, 2025Nature Communications — The first emergence of unprecedented global water scarcity in the Anthropocene (2025)"An increase in TRD, quadrupling the TRD, will affect the ToFE of the 8% of the DZD-prone regions, causing later emergence..."PDF · p. 4]
Catalonia experienced an unprecedented drought: precipitation was more than 50% below the baseline for three consecutive years. This was not ‘another drought’ — there had been nothing like it in the entire 100-year observational record. The reservoirs supplying an urban area of 6 million people were emptying rapidly.
Action 1 — technology at its limits. The city brings every reserve into service: one of Europe's largest desalination plants and a wastewater-reuse system. The unit cost of water increases by more than a factor of 2. But this is not enough — reservoir levels continue to fall.
Action 2 — unavoidable restrictions. The government declares a state of emergency. Increasingly stringent restrictions are imposed, directly constraining the economy:
Action 3 — conflicts over water. Conflicts arise within Spain (Catalonia versus Aragon) and internationally: Spain reduces flows in shared rivers, leaving Portugal with one-third less water than it is entitled to under international agreements.
Temporary relief: spring 2024 was the first season with normal precipitation in 3.5 years.
The analysis reveals a dangerous threshold:
Conclusions: (1) desalination is available only to those with access to salt water; (2) it replaces dependence on free water with dependence on expensive electricity — a classic cascading risk; (3) the energy system is itself a victim of climate change (see topic 04.8, ‘Energy’): 90% of Catalonia's grid is overloaded, and connecting desalination plants requires a multibillion-euro upgrade.
‘Climate whiplash’ (October 2024): a multiyear drought was followed by catastrophic flooding in the neighbouring region of Valencia. The dry, compacted soil could not absorb the torrential rain, multiplying the severity of the flood (a compound event). The Valencian government had to request €31.4 billion in emergency aid; the preliminary estimate of economic losses was €17.5 billion [WMO, State of Global Water, 2025].
Status in 2025: the drought is not over, some restrictions remain in place, and reservoirs in southern Catalonia are virtually empty. The region's economic and demographic development is now directly constrained by water scarcity.
The Catalonia case is not a local problem but a demonstration of Europe's new economic reality: climate shocks are already directly constraining economic activity, requiring massive, unavoidable investment and creating cascading energy, political and social risks. Drought was once a shock that could be waited out; water scarcity is now becoming a chronic condition. Even with new technology, financing and time for adaptation, the system remains vulnerable — the next drought could return it to the brink of collapse. This is happening at +1.5 °C; at +2 °C and +3 °C the situation will be substantially more severe and widespread.
At the current level of warming, it is not only southern regions that are under threat. The United Kingdom — a country with a rainy climate — is facing a systemic water crisis. In 2022, the officially recorded temperature exceeded 40 °C for the first time in history, while more than one-quarter of river flows were classified as exceptionally low.
In key agricultural and industrial regions of the East of England, a long-term ban (until 2033) has been imposed on expanding access to water supplies for businesses. For water-intensive sectors — agribusiness, data centres and beverage production — development in these regions is becoming almost impossible or extremely difficult [Alpheus, 2025; BBC, 2024]. The consequence: a ‘risk of strangling UK economic growth’ [Alpheus, 2025].
Trigger: the 2022 drought — the worst in 40 years; spring 2025 — the driest in 130 years; the temperature reached 40 °C for the first time [Thames Water, 2023; Guardian, 2025].
In winter too: southern England went without water for five consecutive days — freezing weather caused pipes to burst, while Storm Goretti prevented normal water-treatment operations. This was not the first such incident [BBC].
Even in Scotland — one of Europe's wettest regions — the 2025 drought caused levels in reservoirs supplying 300,000 people to fall 40% below the seasonal norm. The region experienced its driest year since 1973 and the 11th-driest start to a year in the 190-year observational record. The water company's management stated directly: ‘if there is another relatively dry winter, more serious supply problems could arise next summer’. The system has lost its safety buffer: it can no longer withstand two consecutive dry seasons, and conditions better than average are required for recovery — a classic sign of a system in deficit.
Conclusion: the crisis in the United Kingdom results from a combination of climate shock, chronic underinvestment and cascading infrastructure failures. All three factors apply to many parts of Europe.
The Colorado River and its reservoirs have been declining after more than two decades of drought — one of the most severe in the past 1,200 years. In 2026, snowpack in the basin fell to the lowest level on record. Climate change made a snow drought of this severity in the Upper Colorado River Basin approximately 14 times more likely. [Nature Climate Change, 2022Rapid intensification of the emerging southwestern North American megadrought in 2020–2021“2000–2021 was the driest 22-yr period since at least 800.”; PNAS, 2026The 2026 western US snow drought was about four times more likely due to climate change“In the Upper Colorado River Basin, the snow drought was approximately 14 times more likely [0.09, 4,300].”]
Scale: water supplies and hydropower for roughly 35–40 million people, as well as water for 5 million acres of farmland, are at risk across seven US states and Mexico, including Los Angeles, Phoenix and Las Vegas. [Nature Communications, 2025Disentangling climate and policy uncertainties for the Colorado River post-2026 operations“provides water and hydroelectricity for 35–40 million people in seven US states and Mexico”; Los Angeles Times, 2026As Colorado River reservoirs shrink, Arizona warns it could sue“The Colorado River provides water for about 35 million people and 5 million acres of farmland...”]
Consequences of “dead pool”: the reservoir falls to a level at which water can no longer flow through the dam by gravity; hydropower generation has already ceased by that point, and critical water deliveries are disrupted. But the systemic crisis begins long before this physical threshold is reached: the 1922 agreement allocated more water among the states than the shrinking river can now reliably provide. [Los Angeles Times, 2026Colorado River legal fight“The 1922 agreement overpromised what the river could provide.”]
The Colorado River crisis is a documented example of systemic failure: climate stress is reducing the physically available resource, the largest reservoirs have reached historic lows, and water scarcity has already escalated into a political conflict between states over who will bear the losses.
Tehran's water crisis reached a stage at which a ‘Day Zero’ scenario was publicly discussed, including water rationing and the evacuation of residents. The authorities lowered pressure in the water network, introduced night-time restrictions and held out the possibility of further rationing. At the highest level, it was acknowledged that the strain on water resources, land and infrastructure had become systemic, calling the resilience of the capital's metropolitan area into question [Guardian, 2026The Guardian — How ‘day zero’ water shortages in Iran are fuelling protests (2026)“water day zero”“Nightly ‘pressure cuts’ … have become the norm”“we should ration water; if it still does not rain, we must empty Tehran”; CSIS, 2025CSIS — Satellite Imagery Shows Tehran’s Accelerating Water Crisis (2025)“water rationing has been imposed on some neighborhoods, and authorities may have to evacuate residents from Tehran”“Tehran is becoming ecologically unsustainable”“damaging roads and infrastructure”; Circle of Blue, 2025Circle of Blue — Satellite Imagery Shows Tehran’s Accelerating Water Crisis (2025)“Tehran’s water footprint has overwhelmed the carrying capacity of its water resources”; PreventionWeb, 2025PreventionWeb — Iran’s president calls for moving its drought-stricken capital (2025)“Tehran … is facing an impending ‘Day Zero’”“chronic water stress and land subsidence”].
The ‘Day Zero’ crises in Cape Town and Barcelona were not random anomalies. Climate models show that these are the first manifestations of a new regime which the Mediterranean region is entering right now; many regions may face a ‘Day Zero’ crisis in the near future [Nature Communications, 2025].
Stepwise degradation: when there is not enough time for recovery, each successive drought begins with lower reserves — creating a risk of step-change degradation across the region's entire water system. The region enters a state of permanent water deficit that can be addressed only through extreme and costly measures: permanent water rationing for industry and agriculture, multibillion-euro spending on desalination and water deliveries, and drilling ever-deeper wells.
It is important to interpret the findings correctly: the study does not claim that every city in Southern Europe will run out of water at the same time. It establishes something more fundamental: the entire Mediterranean region is shifting into a new climate regime in which conditions that once produced ‘once-in-a-century’ crises become normal. The baseline operating risk of every water-dependent asset in the region increases manyfold, and crises will become more frequent because further warming intensifies every component: it reduces water inflows while simultaneously increasing consumption.
Water is becoming an expensive, scarce and unstable commodity rather than an almost free resource.
The area affected by drought has risen to catastrophic levels not only regionally but globally, directly threatening crops, water supplies and sanitation worldwide.
Economic damage from droughts, EU + United Kingdom
[EEA, EUCRA, 2024EEA — European Climate Risk Assessment, EUCRA (2024)PDF · Ch. 11; JRC EDO, 2022]
Chapter
04.3.1
The power sector is where climate risk and water risk converge: high temperatures and drought simultaneously worsen conditions for hydropower and for most thermal and nuclear power plants.
Water intensity of power generation worldwide
Water intensity of power generation in Europe
04.3.2
2026 — Danube: In Hungary, the Paks nuclear power plant, which normally supplies around half of the country’s electricity, was operating at about 10% of capacity. In Romania, one of the two reactors at the Cernavodă nuclear power plant, which normally supplies around 20% of the country’s electricity, was shut down because of low Danube levels. Losing one reactor reduced national generation by roughly 10%. Both countries had to increase electricity imports and urge consumers to reduce demand. [Reuters, 2026Reuters — Hungary PM flags 'critical' days ahead with looming nuclear shutdown“Paks power plant, which generates about half of the country's electricity, was running at just over 10% of its capacity...”Web · 2 August 2026 / Reuters, 2026Reuters — Romania races to divert Danube water as Hungary's Paks runs on last turbine“normally generates a fifth ... shut down one of its two reactors...”“forcing Budapest and Bucharest to increase power imports and urge households and businesses to reduce consumption.”Web · 4 August 2026]
During Spain's 2022 drought, hydropower generation fell by 48%; during the extreme heat of 2003, French nuclear power plants lost up to 25% of their capacity. In 2022–2025, nuclear and thermal power plants in Switzerland and France were forced to shut down because their cooling water was too warm, causing wholesale energy prices to triple [EEA, EUCRA, 2024EEA — European Climate Risk Assessment, EUCRA (2024); WRI].
European generation losses: thermal and nuclear power
European generation losses: hydropower
04.3.3
The cumulative effect of a climate shock (heat and drought) puts the energy system under pressure on two fronts: supply falls at the same time as energy demand rises sharply. This creates a threat of cascading outages (blackouts) and price destabilisation.
04.3.4
Heat affects not only power plants but the grid itself. Failure rates often increase when surface temperatures exceed 30 °C. In the British assessment of energy-system vulnerability, grid assets are identified as the most vulnerable category [DESNZ, 2025UK Department for Energy Security & Net Zero — Impacts on energy assets from extreme heat and heatwaves"Overall, the most vulnerable asset category was power sector networks.""Historical analysis of extreme heat and the electricity system demonstrated that faults have often increased in frequency when surface temperatures exceed 30 °C."PDF · p. 5].
Cables, transformers and grid equipment become hotter or dissipate heat less effectively, causing them to become less efficient, wear out faster or shut down [DESNZ, 2025UK Department for Energy Security & Net Zero — Impacts on energy assets from extreme heat and heatwaves"Underground cables were identified as ‘vulnerable’ ... Extreme temperatures can prevent efficient heat dissipation.""Transformers were identified as ‘vulnerable’ ... extreme temperatures prevent efficient heat dissipation, accelerates insulation degradation, affecting capacity and shortening lifespan."PDF · pp. 33–34].
Weather-related outages are already becoming more frequent. In the United States, there were approximately 60% more major outages during the hot season in 2014–2023 than in 2000–2009. [Climate Central / DOE Form OE-417Climate Central — Heat Season Power Outages"The U.S. experienced about 60% more heat season power outages during the last 10 years (2014-2023) than during the first 10 years analyzed (2000-2009).""Heat season outages accounted for nearly half (47% or 831) of all 1,755 weather-related outages during the 2000-2023 period."Website · data: U.S. Department of Energy Form OE-417] 62.1% of prolonged outages lasting 8+ hours in the United States coincided with extreme weather or climate events. [Nature Communications, 2023Spatiotemporal distribution of power outages with climate events and social vulnerability in the USA"62.1% of 8+ hour outages co-occur with extreme weather/climate events, particularly heavy precipitation, anomalous heat, and tropical cyclones.""8+ hour outages are 3.4x more common on days with a single event and 10x more common on days with multiple events."Article · Results]
Distribution grids in Europe are also becoming increasingly exposed to risk: extreme weather already causes significant damage to grid operators, and that damage is expected to grow rapidly. [Eurelectric, 2025Eurelectric — Strengthening climate resilience"As the damage caused by extreme weather events on grid operators, already significant in 2025, is expected to increase massively, taking actions to enhance resilience is not an option anymore."PDF · p. 2]
This applies primarily to traditional centralised grids. Decentralised energy systems (hybrid solar plants, storage and microgrids) can operate autonomously — even when the main grid suffers a failure. [DOE, 2024U.S. Department of Energy — Microgrid Overview"The primary resilience benefit of microgrids is their ability to disconnect from the main grid when there is an outage and operate autonomously.""Facilities connected to and powered by the microgrid can continue serving a community during an outage."PDF · p. 2] [NREL, 2019National Renewable Energy Laboratory — Power Sector Resilience"Systems that are designed to operate in islanded mode can be isolated from a larger grid, allowing the system to generate and distribute energy on-site in the event of a power outage.""Microgrids are often implemented where on-site renewable energy is combined with energy storage to support resilience."PDF · p. 1]
Thermal and hydropower assets in areas of water stress require an additional discount and stress testing. With their minimal water footprint, solar and wind power are becoming not only a carbon hedge but also a water hedge for the energy system — a hidden resilience advantage under scenarios of +2 °C and above.
Chapter
Food-system vulnerability: The stable climate that sustained reliable harvests for generations is now in the past. We are entering an era of chaotic weather in which droughts, floods and heatwaves reduce crop yields and may strike several of the world’s breadbaskets at once.
Illusion of safety: Countries that consider themselves protected from climate risk may be critically dependent on food imports from the most vulnerable regions.
Social consequences: The climate crisis is already driving up food prices. Experts warn that more expensive food could heighten tensions, potentially leading to civil unrest.
04.4 Food
The food system depends on temperature conditions, water resources and outdoor labour. Heat, moisture deficits and extreme rainfall put pressure on all these pillars at once. This is a systemic risk to global food security and to the 1.23 billion people who depend on agriculture [FAO/WMO, 2026]FAO/WMO — Extreme heat and agriculture (2026)“Extreme heat magnifies existing weaknesses across agricultural systems... These impacts extend far beyond the farm gate. They represent a systemic risk...”“...the livelihoods of more than 1.23 billion people who rely on agriculture.”PDF · p. 9.
Every additional degree of global warming reduces the yields of the main crops that provide 60% of global calorie consumption. The figures below show the average effect per +1 °C: once temperatures exceed a crop’s optimum, the decline becomes non-linear and accelerates [FAO/WMO, 2026FAO/WMO — Extreme heat and agriculture (2026)“the negative impacts associated with high temperature on the productivity of the major grains that supply 60 percent of global caloric food intake (maize, rice, soy, wheat)”“At temperatures above the optimal temperature threshold, a non-linear decline in development is observed...”PDF · pp. 18–19]:
Climate threatens every pillar of production: crop yields, labour and land:
At the same time, the impacts of +2 °C warming could be substantially more severe, as projections at +2 °C vary widely: around a quarter of climate models project stronger droughts across the world’s breadbasket regions at +2 °C than the average estimates for +4 °C [Nature, 2026Bevacqua et al. - Moderate global warming does not rule out extreme global climate outcomes (2026)“Out of 42 models, 10 models show climate outcomes at a 2 °C warming that are well beyond the multimodel mean at 4 °C of global warming.”].
It is widely assumed that climate-driven hunger is a problem for poor countries. The calculations show otherwise: the decline in food-calorie production follows a U-shaped pattern by income. The largest losses occur both in the poorest regions (because they depend on vulnerable crops, especially cassava) and in the richest, where modern ‘breadbaskets’ with high yields but limited current adaptation to heat are concentrated [Impacts of climate change, 2025Impacts of climate change on global agriculture (2025)“global impacts are dominated by losses to modern-day breadbaskets with favourable climates and limited present adaptation.”“We estimate average losses of 28% in the lowest-income decile but more moderate losses of roughly 18% across deciles 2–8. In the highest-income deciles, average losses increase to 29% (ninth) and 41% (top).”PDF · p. 5].
The estimates relate to a high-emissions scenario (RCP 8.5, warming of around +4 °C, by the end of the century) and are compared with a world without climate change. Importantly, this is not a single-day event, but a trend showing the scale of a process already under way. Losses build gradually as temperatures rise. Referring to ‘+4 °C’ or ‘2100’ is merely a model checkpoint. With the current acceleration of climate change, this level could be reached significantly earlier.
At +4 °C the climatically suitable area for rainfed wheat — one of the world’s key food crops — declines, very unevenly across regions. This is a guide to the warming level, not a calendar date: the process is already under way, and with the current acceleration this level could be reached earlier [FAO, SOLAW, 2025FAO — SOLAW 2025 (Table 9, SSP 8.5, 2081–2100)“Under the SSP 8.5 scenario and with an assumption of advanced management conditions in place, projections indicate a net increase in suitable areas for cassava, maize and soybean, but an overall reduction for wheat.”“SSP5-8.5 … Warming (best estimate) (2081–2100) 4.4 °C (very likely range 3.3–5.7 °C).” (Table A.1)PDF · p. 68; Table A.1, p. 130].
For cassava, maize and soybean, the same calculations show an increase in suitable area — but this is ‘maximum potential under ideal conditions, not an actual outcome’: more suitable area does not mean higher yields if climate stresses limit productivity even on newly suitable land [FAO, SOLAW, 2025FAO — SOLAW 2025“This does not necessarily imply higher production of the three aforementioned crops, as the scenarios do not take into account extreme events and socioeconomic factors; the analysis shows the maximum potential, not actual outcomes, under the assumption of ideal biophysical and socioeconomic conditions.”“increased suitable land does not always correlate with increased productivity ... especially if climate stressors limit yields even in newly suitable areas.”PDF · pp. 69–70].
The food system is running up against a physical limit — land scarcity. Expanding agricultural land is no longer viable [FAO, SOLAW, 2025FAO — The State of the World’s Land and Water Resources (SOLAW 2025)“...the potential for agricultural expansion is limited, as further land conversion to cropland would impact other ecosystems, including forests, grasslands and wetlands.”PDF · p. xiv (16); FAO Newsroom, 2025FAO Newsroom — SOLAW 2025 press release“Expanding agricultural area is no longer viable, the report stresses.”FAO Website]. At the same time, population growth requires annual increases in production [FAO, SOLAW, 2025FAO — The State of the World’s Land and Water Resources (SOLAW 2025)“By 2050, the global population is projected to reach 9.7 billion, and agriculture will need to produce around 50 percent more food, feed and fibre than in 2012.”PDF · p. vi (8); FAO Newsroom, 2025FAO Newsroom — SOLAW 2025 press release“...requiring agriculture to produce 50 percent more food, feed and fibre than in 2012, alongside 25 percent more freshwater.”FAO Website]. Without radical changes to agricultural technology and diets, land demand will exceed supply even in a stable climate. The systemic decline in crop yields caused by global warming further aggravates this crisis.
Climate pressure is superimposed on an already depleted land base: more than 1,660 million ha of land (more than 10% of all land on Earth) has already been degraded, and more than 60% of this degradation is on agricultural land [FAO, SOLAW, 2025FAO — The State of the World’s Land and Water Resources (SOLAW 2025)“More than 1 660 Mha of land, corresponding to more than 10 percent of the world’s land area, have been degraded by unsustainable land-use and management practices, with more than 60 percent of this degradation occurring on agricultural lands (including cropland and pastureland).”PDF · p. xvi (16)].
Sea-level rise and groundwater depletion lead to saltwater intrusion in coastal regions. This process renders vast areas of formerly fertile land unsuitable for agriculture. In 2022, in the Po River delta — one of Europe’s most productive agricultural regions — saltwater penetrated a record 40 km inland [EEA, EUCRA, 2024EEA — European Climate Risk Assessment, EUCRA (2024)]. Salinisation alone has already degraded 82 million ha of rainfed and 24 million ha of irrigated cropland [FAO, SOLAW, 2025FAO — The State of the World’s Land and Water Resources (SOLAW 2025)“Conservative estimates of the impact of soil erosion and salinization indicate that 82 Mha of rainfed cropland and 24 Mha of irrigated cropland are degraded from salinization processes alone (FAO, 2024a).”PDF · p. 29].
Food security depends substantially on a water resource that is becoming scarcer. Rather than adapting, the global economy is expanding production through irrigation where water resources are already under stress. Reliable irrigation can support crop yields, but amid groundwater depletion and competition for water from cities, energy and industry, it becomes a source of risk.
The most productive agricultural regions depend on irrigation — and therefore on water reserves that are being depleted. The dependency is concentrated: the bulk of irrigated food is produced where water is already scarce.
Irrigation systems, agricultural land and processing operations without a reliable water supply may look like productive assets, but in essence they depend on a resource that is physically being depleted.
Global production is often concentrated in a few regions, partly because those locations have the best natural conditions for particular crops. A climate shock to one region can therefore cause shortages or price rises worldwide. The current pace of climate change means that conditions to which agriculture is adapted will be disrupted ever more often [Kotz et al., 2025]Kotz et al. — Climate extremes, food price spikes, and their wider societal risks (2025)“With current policies and actions set to lead to global warming of between 2.2 °C and 3.4 °C above pre-industrial levels, unprecedented conditions are set to become increasingly common across the world.”“At the same time, new records for extreme conditions will continue to be set, further from those to which agricultural production and economic systems are currently adapted.”PDF · p. 4.
In the report ‘Global biodiversity loss, ecosystem collapse and national security’ (2025) UK intelligence highlights the vulnerability of the country’s food system to climate and environmental shocks [HM Government, 2025Global biodiversity loss, ecosystem collapse and national security (2025)“Ecosystem degradation or collapse will challenge the UK’s food security... The UK imports 40% of its food from overseas... The UK is unable to be food self-sufficient at present, based on current diets and prices.”PDF · p. 10]:
Heat and drought increasingly create a risk of simultaneous shocks to several agricultural regions: in the mid-latitudes of the Northern Hemisphere, the frequency of concurrent heatwaves has increased approximately 6-fold over 1979–2019. [FAO & WMO, 2026FAO/WMO — Extreme heat and agriculture (2026)“concurrent heatwaves ... across the mid-latitude regions (30° to 60° North) in the Northern Hemisphere between 1979–2019”“an approximately 500 percent (or six-fold) increase in their frequency”PDF · p. 7]. The risk of ‘synchronised crop failure’ is growing: persistent Rossby waves can cause extreme heat simultaneously in key agricultural regions of North America, Europe and Asia. For the most severe events, the likelihood of such concurrent extremes increases by a factor of up to 20. [Kornhuber et al., 2020Nature Climate Change — Amplified Rossby waves enhance risk of concurrent heatwaves in major breadbasket regions“Those patterns can induce simultaneous heat extremes in specific regions: Central North America, Eastern Europe and Eastern Asia for wave 5, and Western Central North America, Western Europe and Western Asia for wave 7.”“The probability of simultaneous heat extremes in these regions increases by a factor of up to 20 for the most severe heat events...”PDF · p. 1].
If several key producing regions — ‘breadbaskets’ — are hit by climate shocks simultaneously, the global market may respond with food-price spikes, threatening global food-market stability and food security. [IFPRI / CGIAR, 2025Global Food Security Impacts of Extreme Weather Events and Occurrence of Breadbasket Failures“...multiple breadbasket failures have happened in the past and are expected to pose major threats to global food market stability and food security...”“...synchronized agricultural losses, reducing food availability and driving up food prices, thus undermining food security...”PDF · p. 16]. Countries and regions dependent on food imports are particularly vulnerable. [IFPRI / CGIAR, 2025Global Food Security Impacts of Extreme Weather Events and Occurrence of Breadbasket Failures“These conditions underscore the critical role of global trade in shaping domestic food prices and food security.”“...particularly vulnerable to crop failures not just within their own borders or regions but also in major crop-exporting countries elsewhere in the world.”PDF · p. 16].
This is not only a risk of synchronous pressure on different countries. A single season of climate shocks can simultaneously disrupt several regions within one country, affecting different production channels: water, crop yields, livestock, wildfires, labour productivity and logistics [FAO & WMO, 2026FAO/WMO — Extreme heat and agriculture (2026)“...extreme heat is a major risk multiplier, exerting mounting pressure on crops, livestock, fisheries and forests...”“The full danger of extreme heat lies not only in its direct impacts, but also in its role as a risk multiplier, amplifying the effect of water stress, serving as a trigger of flash droughts and elevating the risk of wildfires...”PDF; Malik et al., 2022Nature Food — Impacts of climate change and extreme weather on food supply chains cascade across sectors and regions in Australia“Disruptions caused by extreme weather events can cascade across regions and sectors, resulting in job and income losses and impacts on food availability.”Article · Nature Food].
Climate change therefore acts as a geopolitical threat multiplier: local agronomic problems can turn into market, social and political crises, while conventional diversification ‘by region’ loses some of its protective value. [FAO & WMO, 2026FAO/WMO — Extreme heat and agriculture (2026)“This work highlights how extreme heat is a major risk multiplier...”“More than simply an isolated climatic hazard, it acts as a compounding risk factor that magnifies existing weaknesses across agricultural systems.”PDF; Kornhuber et al., 2020Nature Climate Change — Amplified Rossby waves enhance risk of concurrent heatwaves in major breadbasket regions“As these regions are important for global food production, the identified teleconnections have the potential to fuel multiple harvest failures, posing risks to global food security.”PDF · p. 2].
Brazil illustrates why food risk cannot be treated as a single type of disaster. In the 2023–2024 season, prolonged heat hit soybeans: CONAB’s national forecast was cut from 162 to 147.7 million tonnes, almost 10%, and soybean-yield losses in São Paulo were estimated at more than 20%. Flooding in Rio Grande do Sul, which produces more than 70% of Brazil’s rice, then reduced rice productivity and destroyed up to 2 million tonnes of soybeans [FAO/WMO, 2026FAO/WMO — Extreme heat and agriculture (2026)“Initial forecasts from Brazil's National Supply Company, CONAB ... projected a record crop of 162 million metric tonnes. However ... by May 2024, the estimate was slashed to 147.7 million metric tonnes, a reduction of nearly 10 percent.”“For example, the reduction in soy yield was estimated to be more than 20 percent in the state of São Paulo.”“Rio Grande do Sul, which accounts for over 70 percent of Brazil's rice output, saw productivity reduced by 3.6 percent over the previous harvest.”“The flood led to the destruction of up to 2 million tonnes of soybeans.”PDF · pp. 62, 68].
Climate pressure on agriculture creates a systemic cascading risk. The physical limit on arable land means that falling crop yields cannot be offset by bringing ever more land into production, turning this shortage into a long-term systemic driver of structural inflation and macroeconomic destabilisation.
Chapter
Climate change is turning megafires from rare anomalies into a new regular occurrence. Asset destruction and smoke pollution create major economic costs.
04.5 Wildfires
Climate change has significantly increased the likelihood of extreme fire-weather conditions (FWI) in the Mediterranean:
Worldwide, the number of days per year with fire-prone conditions has almost tripled since the 1980s [Nature, 2026Increasing synchronicity of global extreme fire weather“The number of days per year with fire-prone conditions has nearly tripled globally since the 1980s...”Nature Ecology & Evolution]. What used to happen once every 100 years before climate change now occurs every 10–18 years. At +2.6 °C of warming, such extreme fire-weather conditions will occur almost every year [WWA, 2025World Weather Attribution (2025)“The event in today's climate is about a 1 in 10 year event, whereas in a 1.3°C cooler climate, it would be expected to occur once in every 100 years. ... The DSR is projected to become another 25% more intense and another nine times more likely.”PDF · p. 3].
The growing number of major wildfires causes significant damage and spreads smoke, creating serious air-quality problems even far from the source [EEA, EUCRA, 2024EEA — European Climate Risk Assessment, EUCRA (2024)]. This also means direct economic losses (timber, infrastructure and tourism) and long-term ecological damage that undermines forests’ ability to absorb CO₂.
Climate model estimates vary widely, and warming could have a substantially greater effect. The four models with the most severe projections show more extreme fire-weather conditions across the world’s forests at +2 °C than the average projection for +3 °C. The highest and lowest estimates at +2 °C differ by more than a factor of four [Nature, 2026Bevacqua et al. - Moderate global warming does not rule out extreme global climate outcomes (2026)“The four worst-case models at a moderate 2 °C warming show an increase in FWI extremes across forests larger than the multimodel mean projection at 3 °C warming...”“...the worst-case model showing an increase more than 4-times larger than the best-case model (+6.5 against +1.5 relative to preindustrial conditions...)”].
Wildfires have evolved from one-off force majeure events into a predictable systemic risk. The cumulative impacts of infrastructure destruction, a catastrophic deterioration in air quality and insurers withdrawing from ‘red zones’ make it essential to include wildfire indices when assessing the long-term resilience of assets and property portfolios.
Chapter
Flood risk in Europe is rising significantly. Losses from a single event can reach double-digit shares of GDP, creating a direct threat of sovereign default.
04.6 Flooding
Flood risk in Europe is rising significantly. For Central and Western Europe, it is the principal climate risk: floods account for 50% of all weather-related losses [Swiss Re, 2024]. Without additional protection, annual damage from coastal flooding alone could exceed €1 trillion by the end of the century.
Land subsidence compounds flood risk in coastal megacities: the land sinks towards the rising sea. In England, where every degree of warming allows the atmosphere to hold about 7% more water vapour, 6.3 million homes are already in areas at risk of flooding from rivers, the sea or surface water [Euronews, 2025].
At +2 °C, extreme five-day precipitation in densely populated areas increases by 4-15% relative to the pre-industrial climate, depending on the model. The most severe projections at +2 °C already exceed the average projection for +3 °C [Nature, 2026Bevacqua et al. - Moderate global warming does not rule out extreme global climate outcomes (2026)“In a 2 °C world, heavy precipitation projections over populated areas vary widely across climate models, ranging from an increase of 4% to 15%.”“The worst-case climate outcome is particularly extreme, with precipitation extremes across populated areas at a moderate 2 °C warming projected to exceed the multimodel mean at 3 °C of global warming.”].
The intensity and financial consequences of flooding are rising sharply; a single event can create liabilities equivalent to a share of a country’s annual GDP. Mutual-aid mechanisms (EUSF) are already operating at their limit — the next trigger could be systemic.
Hidden burden: official statistics capture only a small fraction of the losses.
A decade-long legacy: the consequences of storms extend over a decade.
Systemic driver: hurricanes are one of the largest unaccounted drivers of mortality.
04.7 Hurricanes and tropical storms (the US example)
A recent study of excess mortality after tropical cyclones in the continental United States (1930–2015) found that the conventional approach to counting losses radically understates their true scale [Nature, 2024Nature — Mortality caused by tropical cyclones in the United States (2024)“we estimate that the average TC indirectly accelerated the death of roughly 7,170–11,430 individuals... This burden is 300–480 times greater than government (NOAA) estimates”PDF · pp. 3, 5].
Hurricanes and tropical storms are not merely short-lived shocks, but systemic drivers of long-term excess mortality. The absence of evidence of autonomous adaptation over almost a century of observations indicates that current response strategies are insufficient to protect people from growing risks.
Chapter
Seemingly the slowest-moving yet irreversible climate risk. The financial impact arrives long before the water rises — through the repricing of coastal assets by markets, insurers and banks.
04.8 Sea level
The ocean is warming and expanding, and melting glaciers add even more water — causing sea level to rise [NASA, 2024Hamlington et al. — The rate of global sea level rise doubled during the past three decades (2024)"The ocean has absorbed about 90% of the extra heat trapped by the atmosphere, leading to an expansion in ocean waters as it warms."PDF · p. 1]. The process is nearly irreversible over generational timescales: part of the future rise is already ‘locked in’ today and will continue for centuries even if emissions stop [Royal Society, 2026Millman, Siegert, Alley — The achievability of low-emission IPCC sea-level rise scenarios (2026)"approximately 30 cm of additional sea-level rise is already committed from the Greenland Ice Sheet."PDF · p. 2].
A direct consequence of sea-level rise is the growing risk of permanent inundation or storm-surge flooding along densely populated low-lying coastlines and in major coastal cities. This threatens cities such as Shanghai, Miami, New York, Alexandria, New Orleans, Tokyo, Mumbai, Osaka–Kobe, Guangzhou, Ho Chi Minh City, Kolkata, Tianjin, Bangkok, Dhaka and Hai Phong [OECD, Ranking Port Cities with High Exposure, 2008OECD Environment Working Papers"Top 20 cities in all the rankings include Mumbai, Guangzhou, Shanghai, Miami, Ho Chi Minh City, Kolkata, New York, Osaka-Kobe, Alexandria, New Orleans, Tokyo, Tianjin, Bangkok, Dhaka and Hai Phong."PDF · p. 8]. More than 150 million people live less than 1 m above sea level — directly exposed to flooding [Lancet Countdown, 2025The 2025 report of the Lancet Countdown on health and climate change"in 2024, 156·7 million people were living less than 1 m above current sea levels as of December, 2024""Between 1993 and 2023, the global average sea level rose by 101·4 mm and is projected to continue rising."PDF · p. 24].
At the same time, protecting most of the coast is not economically viable — investment pays off along only about 13% of the world’s coastline; the rest faces managed or unmanaged retreat.[Nature Sustainability, 2026Molino et al. — Sea-level-driven land conversion amplified by coastal agriculture (2026)"traditional economic metrics justify the protection of only 13% of the global coastline."PDF · p. 5].
New York shows that this is no longer a distant scenario: the city has more than 500 miles of shoreline, and sea-level rise already threatens waterfront neighbourhoods in all five boroughs. The number of days with tidal flooding in New York rose by 200% between 2000 and 2021, while much of the shoreline remains without comprehensive protection. Just one project to protect Lower Manhattan and the Seaport district is estimated at $5.5 billion in 2025 prices and could rise to $8–9 billion by the time construction begins; the city explicitly identifies funding as the main remaining barrier [NYC Health, 2024New York City Department of Health and Mental Hygiene"Data show that there was a 200% increase in high tide flood days from 2000 to 2021.""The sea level in NYC is rising, which makes powerful storm surges worse."Website; NYC Comptroller, 2019Safeguarding Our Shores"With more than 500 miles of coastline, New York City sits on the frontlines of climate change.""Rising sea levels already threaten the safety of our shorefront communities across all five boroughs.""much of our coastline remains unprotected from the next storm."PDF · p. 3; NYC FiDi-Seaport Climate Resilience Plan, 2025Implementation"The estimated capital cost of the FiDi-Seaport Climate Resilience Plan is $5.5 billion in 2025 dollars.""with escalation, the total project cost will be an estimated $8-9 billion.""the biggest barrier that remains is funding."Website].
The rise is already under way — and accelerating
Official projections represent the lower bound of the risk range. Observations show that sea-level rise is happening faster than projected, while ice-sheet models underestimate the pace of break-up — so official projections are likely to understate future rise [Royal Society, 2026Millman, Siegert, Alley — The achievability of low-emission IPCC sea-level rise scenarios (2026)"Observations suggest we are currently tracking sea-level rise pathways consistent with intermediate- to high-emission scenarios... projections may underestimate the true pace and magnitude of future sea-level rise."PDF · p. 12].
The ‘global’ figure understates local risk. Because of land subsidence and ocean currents, sea level is rising twice as fast as the global average along some coastlines — for example, along the Atlantic coast of the United States [Nature Sustainability, 2026Molino et al. — Sea-level-driven land conversion amplified by coastal agriculture (2026)"the mid-Atlantic coast represents a known hotspot of global SLR, with RSLRR double the global average."PDF · p. 6].
Sea-level rise is a physically irreversible process whose impacts — stronger storm surges, coastal erosion and freshwater salinisation — are already damaging coastal infrastructure and agriculture. Asset degradation and rising spending on coastal protection begin long before land is submerged.
Chapter
Foundation of the economy: Biodiversity is not just nature; it is the basic infrastructure for humanity’s survival. Pollinators, soil formation, pest control and the water cycle all depend on complex ecosystems.
Systemic collapse: Biodiversity loss has moved from the environmental agenda into the national security domain. Key ecosystems are on the brink of collapse, threatening to trigger cascading shocks across the global economy.
04.9 Biodiversity
Biodiversity — is the variability among living organisms from all sources, including terrestrial, marine and other aquatic ecosystems and the ecological complexes of which they are part.
Biodiversity and nature’s contributions to people underpin the economy, so all businesses depend on biodiversity, directly or indirectly. Biodiversity loss is no longer solely an environmental problem; it has become a systemic risk threatening the entire global economy, financial stability and human well-being [IPBES, 2026IPBES Business and Biodiversity Assessment Summary for Policymakers“Biodiversity and nature's contributions to people underpin the economy, so all businesses depend, directly or indirectly, on biodiversity... The decline in biodiversity... has become a critical systemic risk threatening the economy, financial stability and human wellbeing”PDF · p. 5]. The degradation of nature is classified as a factor capable of undermining the foundations of the global economy and geopolitical stability.
Diverse species and habitats provide clean air and water, fertile soils and pollination, supporting food security, livelihoods and health, regulating the climate and protecting against extreme events. Climate change is one of the main causes of biodiversity degradation [ESOTC, 2025European State of the Climate (ESOTC) 2025“Diverse species and habitats support clean air and water, fertile soils and pollination, contributing to food security, livelihoods and health... regulate the climate and protect against extreme events. Climate change is a major cause of its degradation.”PDF · p. 9]. At the same time, climate change and biodiversity loss reinforce each other in destabilising ways [10NICS, 202510NICS (2025)“Mounting evidence shows that climate change and biodiversity loss reinforce each other... 3–6 million (or more) animal and plant species are threatened, even under intermediate climate change scenarios.”].
Climate change is causing species to lose part of their climatically suitable range — the area where conditions remain suitable for them to live and reproduce. The tables below show the share of species that could lose more than half of that range. [Price et al., 2024 / Warren et al., 2018Biodiversity losses associated with global warming of 1.5 to 4 °C“At 2 °C, these projections of loss fall to 18% of insects, 16% of plants and 8% of vertebrates...”“...for warming of 3.2 °C... ~49% of insects, 44% of plants and 26% of vertebrates...”Article · review of the estimate by Warren et al., 2018].
Global economic growth over recent centuries was paid for with ecological capital. The global economy is in a state of ‘advanced ecological overshoot’, where the scale of human pressure exceeds the planet’s capacity to regenerate.
The economic impact of nature loss could equal that of the 2008 financial crisis or the COVID-19 pandemic within the next 10 years [Tipping into the wild unknown, 2026IFoA & Anglia Ruskin University — Planetary Solvency: Tipping into the wild unknown (2026)"a material risk of biodiversity and nature-related macroeconomic impacts equalling the 2008 Global Financial Crisis, or even the Covid-19 pandemic, within the next 10 years."PDF · p. 29]. Even the ‘conservative’ estimate of a 15% loss of global GDP by 2050 is based on models that account for climate impacts on only 13% of economic sectors and completely ignore tipping-point risks (meaning that actual damage is significantly underestimated) [Planetary Solvency, 2025IFoA & University of Exeter — Planetary Solvency: finding our balance with nature (2025)"the expected value … showing a 15% reduction in global GDP by 2050.""it also excludes 87% of the economy from analysis."PDF · p. 13].
75% of loans to companies in the EU are exposed to risks arising from nature degradation (clean water for production and cooling, pollination for agriculture, and timber for construction) [ECB, 2023]ECB — Surface water scarcity puts ~15% of euro-area output at risk (2025)“72% of euro area firms are critically dependent on ecosystem services … three-quarters of all corporate bank lending”.
The global economy values natural capital at a massive discount. The financial system continues to direct trillions of dollars into activities that destroy nature, while ignoring the systemic risks this degradation creates for assets.
Since 1992, produced capital per capita has increased by 100%, while natural capital has fallen by 40% [IPBESIPBES Business and Biodiversity Assessment Summary for PolicymakersNatural capital has fallen by 40% since 1992.].
In 2025, the UK government officially classified global biodiversity loss and ecosystem collapse as a direct threat to national security, capable of leading to food shortages, water crises, forced migration and conflict [HM Government, 2025Global biodiversity loss, ecosystem collapse and national security (2025)“Global ecosystem degradation and collapse threaten UK national security and prosperity.”].
Biodiversity is foundational infrastructure. Ignoring ecosystem limits causes established business models to suddenly become unviable. The financial sector is largely ‘blind’ to these risks, creating a systemic vulnerability in the valuation of long-term assets.
Chapter
Climate-related disasters are becoming a powerful driver of internal migration. The economic risks arise not from external ‘waves of refugees’, but from the displacement of millions of people within countries and the loss of labour capacity.
04.10 Migration
In 2025, disasters — storms, floods, fires and droughts — caused 29.9 million new or repeated internal displacements across 140 countries. This was 35% below the record set in 2024, but still 13% above the ten-year average — a year-on-year decline, not a reversal of the trend [IDMC, GRID 2026IDMC — Global Report on Internal Displacement 2026“Disaster displacements declined in 2025 to 29.9 million new or repeated movements across 140 countries and territories. This was a 35 per cent decrease from the exceptionally high levels recorded in 2024 but still 13 per cent higher than the decadal average.”PDF · p. 7].
Two measures need to be distinguished. Displacements (movements) — the number of times people were forced to move during the year; one person may be counted several times in a single year. Internally displaced persons (IDPs) — the number of people still living away from home on a particular date. In 2025, the annual flow of displacements declined, while the cumulative number of people remaining displaced by disasters increased: their consequences persist.
Estimates of how much the number of climate migrants will increase differ by an order of magnitude. The authors describe the forecasts as ‘indicative at best’ and stress that in some contexts migration may even decline. This is not a reason to ignore the risk — it is a reason not to replace a range with a convenient single figure [JRC, 2025JRC — Forecasting Climate Migration: How Much Do We Really Know? (2025)“Forecasts of the number of climate migrants are indicative at best; the numbers predicted are very much uncertain and some ignore the fact that in some contexts, migration may even decrease.”PDF · p. 2].
The year in these projections is a function of the warming level built into the model, not an independent date. At the current rate of acceleration, the actual timing could move forward by years.
Benchmark estimates of future climate migration
Estimates based only on the observed historical relationship between climate and migration produce cautious figures. An IMF working paper concludes that future flows will rise — from 60 million per decade in 2010 to 88–121 million by 2050 — but that the increase is driven primarily by population growth in origin countries, while changes in average climatic conditions add fewer than 5 million migrants a year [IMF WP, 2024IMF Working Paper WP/24/58 — Climate Variability and Worldwide Migration (Cattaneo et al., 2024)“…the most important driver of migration is population growth, while changes in decadal average climatic conditions alone are responsible for a small fraction of the projected migration flows.”“In most cases, climate change increases the outflows of migrants by much less than 5 million per year.”PDF · pp. 8, 18]. This is a lower bound: the model uses decadal averages, does not account for nonlinear or cascading effects, and its authors themselves acknowledge that under strong warming it moves far beyond the historical sample — meaning that the sensitivity of migration to climate may be underestimated [IMF WP, 2024IMF Working Paper WP/24/58 (Cattaneo et al., 2024)“In other words, for scenarios of very high warming in the far future, we push our model considerably out-of-sample.”“…the role of global warming and intensification of some extreme events appears to be marginal.”PDF · p. 21]. The same methodological trap also understated earlier economic estimates of climate damage — until accounting for cascading effects raised them several-fold.
With that caveat, the model’s own conclusions are:
The absolute numbers are disputed and, by the models’ own admission, are probably underestimated. What matters is not so much the volume as the pressure on receiving communities: even relatively small flows already overwhelm cities and exacerbate tensions in destination regions. Climate migration is primarily internal movement within poorer regions, amplified by demographic growth; the focus of risk shifts to the resilience of origin regions, food, water and labour channels, and receiving cities.
The link between climate and migration can be traced in data from Mexico: extreme drought during the maize-growing season significantly increases the likelihood of crossing the border illegally the following year. If extreme weather persists at home, migrants are less likely to return — climate does more to keep them abroad than to push new migrants out [Zhu et al., 2024PNAS — Weather deviations linked to undocumented migration and return between Mexico and the United States (Zhu et al., 2024)“Very dry weather has a statistically significant association (P < 0.05) with a higher likelihood of undocumented crossings in subsequent year; other rainfall and temperature extremes do not.”“The weather impacts on migration are small relative to those impacts on return decisions.”PDF · pp. 4, 8].
The relationship ‘more disasters → more refugees’ is not linear. Climate can lead to both more and less migration — depending on the context and people’s resources. The poorest often cannot leave: migration costs money, and a lack of funds ‘traps’ people in the risk zone.
Because climate migration is predominantly internal, the burden falls not on international borders but on cities — especially the megacities of poorer countries, where infrastructure is already weak. Cities already host 70% of the world’s refugees and displaced people; about 95% of urban growth occurs in low- and middle-income countries [MMC, 2022Mayors Migration Council — Climate Migration in Mexican and Central American Cities (2022)“…the primary destination of international and internal migrants and home to 70 percent of the world's refugees, internally displaced persons (IDPs), and stateless people.”PDF · p. 6].
The absolute numbers are disputed and probably underestimated by models, but even moderate flows already create political and fiscal pressure in receiving countries. The planning horizon should be tied to +2 °C and population growth rates in origin countries, not to a single figure.
Chapter
04.11.1
The cumulative effect of several heatwaves and droughts can overwhelm systems that lack sufficient resilience. The main danger is not individual events but their destructive combinations.
Severe heat and drought dry and compact the soil, turning it into something like asphalt. When a downpour follows, the water does not soak in but runs over the surface, causing catastrophic sudden floods (flash floods) even where none have ever occurred. Warm air holds considerably more moisture (~7% for every degree of warming), so downpours after heat become abnormally intense — ‘rain bombs’. Not only are heatwaves and extreme precipitation becoming more frequent separately, but the likelihood of their dangerous combination is also rising: the atmospheric conditions that produce heat simultaneously ‘charge’ the atmosphere for the powerful downpour that follows [Zhou et al., 2024].
04.11.2 Overlapping shocks
Climate change does not unfold in a vacuum. Wars, supply-chain disruptions and economic shocks that periodically destabilised the world in the past now intersect with the climate crisis. These shocks affect the same vulnerable systems: water supplies, crop yields, food prices and national sovereignty. The combination of conflict and climate shocks is already the leading cause of acute food insecurity worldwide [World Bank, 2026Food and Nutrition Security Update“Conflict and climate shocks continue to be the primary drivers of acute food insecurity ... higher energy, fertilizer, logistics, and food costs are increasing pressure on poorer households”PDF].
Some examples of these interconnections:
Compound events and cascading risks change the very nature of how losses arise: they do not add up, they multiply. Models that assess hazards in isolation systematically underestimate the overall risk to regions and portfolios.
Part 5
Banks · insurers · crisis mechanism · public response · actuaries · a bridge to repricing.
05.1 The banking system's response
An analysis of documents from 2024–2025 reveals a fundamental shift in corporate planning: from attempts to prevent climate catastrophe to preparing for its consequences. The findings draw, among other sources, on OMFIF (the independent forum for central banks, sovereign wealth funds and think tanks) and research by the University of Oxford on sustainable finance.
The main obstacles are limited risk-modelling capabilities and a lack of data with which to assess these risks.
For banks, climate risk primarily means a deterioration in borrowers' ability to pay. Borrowers face two main types of risk [BIS, Incorporating physical climate risks into banks' credit risk models, 2025]BISThe bank for the world's central banks — Incorporating physical climate risks into banks' credit risk models (2025)“physical risks in banks’ capital requirements, loan loss provisions, pricing of loans … RWA rises as much as by 20%”:
05.2 The insurance industry's response
Banking models show only the ‘tip of the iceberg’. Documents from the world's largest insurers provide a clearer picture of what is happening ‘below the surface’ and why it is potentially catastrophic:
‘We are rapidly approaching temperature levels—1.5 °C, 2 °C, 3 °C—at which insurers will no longer be able to offer cover for many of these risks. The maths does not work: the required premiums exceed what people or companies can afford. This is already happening’
AllianzOne of the world's largest financial services and insurance groups · public statement by a board member, 2025
The withdrawal of insurers is the first ‘black swan’ already in flight. Assets in areas the insurance market deems ‘uninsurable’ because the risks are excessively high become ‘toxic’: they lose collateral value and liquidity, and begin generating losses.
The problem is compounded by the vast gap between official—and market—risk assessments and assets' actual vulnerability to fires, floods, droughts, hail, hurricanes and mudslides. Official maps, such as those of FEMA, the US Federal Emergency Management Agency, which guide authorities, developers and buyers, are outdated and do not reflect the real risks of a changed climate [Marsh McLennan, 2025Marsh McLennan — 2025 State of Flood Report“increase in flooding events, even in areas previously considered low risk”; FSF, 2025First Street — 8th National Risk Assessment: The Precipitation Problem (2023)“these formerly rare events are now occurring as often as every 5 or 10 years … data that do not reflect current rainfall conditions”].
The situation is further exacerbated because people—and the market—continue to ignore climate risks. Economic development is concentrating in places people need to leave.
This trend does more than increase the number of future victims: it systematically concentrates future financial losses and ‘hidden credit risks’ in geographic danger zones [FSF, 2025; Aon, 2025].
Climate change could substantially deepen economic inequality, turning it into a geographic divide: affluent groups will be able to buy safety in expensive ‘climate havens’, while the economically vulnerable will be trapped with depreciating assets and growing threats.
The $1.8 trillion ‘protection gap’ is effectively the ‘dark matter’ of the financial system: risk that is neither recognised, assessed nor managed, creating enormous systemic vulnerability [UNU-EHS, 2023]. Emerging economies have vast protection gaps (China 94%, India 93%, South Africa 83%), while the gaps are smaller in advanced economies (UK ~21%, Australia ~30%, Canada ~35%) [Allianz Research, Climate Adaptation Report, 2025]. In Greece, the gap exceeds 80%—only 18.2% of homes are insured [WWA, 2025World Weather Attribution (2025)“In March 2025, only 18.2% of residences were insured”PDF · p. 31]. The case of Italy: an 83% gap, 75% of homes in risk zones, and 98% of seismic losses in 1980–2021 uninsured.
Part 6 · breaking point
The withdrawal of insurers from entire regions sets off a chain reaction across the financial system—from mortgage markets to sovereign debt.
06.1 Insurer's warning · AllianzOne of the world's largest financial services and insurance groups, 2025
A board member of AllianzOne of the world's largest financial services and insurance groups, one of the world's largest insurers, explicitly warns of a potential cascading financial crisis that starts with the withdrawal of insurers and leads to a collapse in the mortgage market and banking instability:
‘This is not a one-off market adjustment. This is a systemic risk that threatens the very foundation of the financial sector. If insurance becomes unavailable, other financial services become unavailable too. A home that cannot be insured cannot be mortgaged. No bank will lend against a property that cannot be insured. Credit markets freeze. This is a credit crunch caused by climate change.
This applies not only to housing, but also to infrastructure, transport, agriculture and industry. The economic value of entire regions—coastal, arid and wildfire-prone—will begin to disappear from financial balance sheets. Markets will reprice these assets rapidly and harshly. This is what climate-driven market failure looks like.’
Günther Thallinger · board member of AllianzOne of the world's largest financial services and insurance groups, 2025
Climate, risk, insurance: the future of capitalism
Carbon dioxide emissions directly increase the amount of energy retained in the Earth's atmosphere. This is neither a vague nor a future problem—it is physical reality. The more emissions, the more energy is retained. The more energy, the more extreme the atmosphere's behaviour. Storms intensify. Heatwaves last longer. Rainfall becomes heavier. Droughts deepen. This is the starting principle.
These extreme weather events create direct physical risks for every category of asset people own: land, homes, roads, power lines, railways, ports and factories. Heat and water destroy capital. Flooded homes lose value. Overheated cities become uninhabitable. Entire asset classes are deteriorating in real time, resulting in lost value, business disruption and system-wide market depreciation.
The insurance industry has historically managed these risks. But we are rapidly approaching levels of warming—1.5 °C, 2 °C, 3 °C—at which insurers will no longer be able to offer cover for many of them. The maths ceases to work: the required insurance premiums exceed what people or companies can pay. This is already happening. Entire regions are becoming uninsurable. See: the 2023 withdrawal of State Farm and Allstate from California's home-insurance market because of wildfire risk.
This is not a one-off market adjustment. This is a systemic risk that threatens the very foundation of the financial sector. If insurance is no longer available, other financial services become unavailable too. A home that cannot be insured cannot be mortgaged. No bank will lend against an uninsurable property. Credit markets freeze. This is a climate-driven credit crunch.
This applies not only to housing, but also to infrastructure, transport, agriculture and industry. The economic value of entire regions—coastal, arid and wildfire-prone—will begin to disappear from financial balance sheets. Markets will reprice them rapidly and ruthlessly. This is what climate-driven market failure looks like.
Some argue that the state will step in where insurers withdraw. But this assumes that the state—that is, the taxpayer—can afford to do so. That assumption is already breaking down. Covering the cost of three or four major wildfires or floods in a single year strains public budgets to the limit. If several costly events occur in quick succession, as climate projections indicate, no government can realistically cover the damage without severe austerity or collapse. See: Germany's 2021 flood relief of €30 billion; the increase in Australian disaster-relief spending in 2020–2023.
There is also false comfort in ‘adaptation’, because many risks allow no meaningful adaptation. It is impossible to ‘adapt’ to temperatures beyond the limits of human endurance. The scope for adapting to megafires is limited; in practice, the only option is not to build near forests. Entire cities built on floodplains cannot simply move uphill. And as temperatures continue to rise, adaptation itself becomes economically unviable.
Once warming reaches +3 °C — +3,8 °C, the situation becomes locked in. Atmospheric energy at that level will persist for more than 100 years because of the inertia of the carbon cycle and the absence of scalable industrial carbon-removal technologies. There is no known pathway back to conditions below 2 °C. See: IPCC Sixth Assessment Report, 2023; NASA Earth Observatory, ‘The Long-Term Warming Commitment’.
At that point, risk cannot be transferred because there is no insurance. It cannot be absorbed because governments lack the capacity. Adaptation cannot address it because physical limits have been exceeded. This means no more mortgage lending, no new development, no long-term investment and no financial stability. The financial sector as we know it ceases to function. And with it, capitalism as we know it ceases to be viable.
Capitalism must now address this existential threat. The idea that market economies can continue to function without insurance, finance and asset protection is a fantasy. There is no capitalism without functioning financial services. And there are no financial services without the ability to assess and manage climate risk.
There is only one path forward: prevent any further increase in the level of energy in the atmosphere. That means preventing emissions from entering the atmosphere. It means burning less carbon-based fuel or capturing emissions at the point of combustion. These are the only two levers. Everything else is delay or distraction.
The good news is that we already have the technologies to move from burning fossil fuels to zero-emission energy. Solar power, wind power, battery energy storage, green hydrogen, electrification, grid upgrades and demand-side efficiency are all mature, scalable solutions.
All that is missing is speed and scale—and an understanding that this is not about saving the planet. It is about preserving the conditions in which markets, finance and civilisation itself can continue to function.
Source: Günther Thallinger, LinkedIn, 2025 — «Climate, risk, insurance: the future of capitalism».
06.2 Crisis mechanism
BISThe bank for the world's central banks, the UN, EEAEuropean Environment Agency and AllianzOne of the world's largest financial services and insurance groups confirm that, over the past few years, physical risks have moved from a niche concern for insurers to a systemic risk factor for financial markets. The collapse of insurance is a direct mechanism leading to a financial crisis [UNU-EHS, 2023UNU-EHS — An uninsurable future? The insurance protection gap and climate change (2023); BIS, 2025BIS — Incorporating physical climate risks into banks' credit risk models (2025)“Climate change presents a systemic risk”; EUCRA, 2024EEA — European Climate Risk Assessment, EUCRA (2024)“from a niche domain of (re)insurers into a systemic risk factor”].
Physical climate risks reach a bank's balance sheet and income statement through several channels: disasters incapacitate borrowers' assets, reducing collateral values and income from damaged properties; because climate events affect many borrowers simultaneously, increasing default correlation, a bank with lending concentrated in a risk zone can suffer substantial losses (making regional banks particularly vulnerable) [BIS, 2025BIS — Incorporating physical climate risks into banks’ credit risk models (2025)“Physical risks are transmitted to a bank’s balance sheet and P&L through different channels. For example, natural disasters... affect households and corporate borrowers by impairing their fixed assets... This, in turn, impacts the creditworthiness of the obligors by decreasing the value of collateral...”“Since climate-driven events commonly affect multiple borrowers at the same time, thus driving up correlation of defaults in the loan portfolio, a bank may incur in significant losses if it has a concentration of credit exposures...”PDF].
This resembles the 2008 crisis, but the root cause is not a temporary problem with toxic securities; it is the permanent physical vulnerability of assets that are gradually dropping out of the economy. This is why BISThe bank for the world's central banks and the ECB propose integrating climate risks into prudential rules—that is, increasing banks' capital requirements (RWA) [BIS, 2025BIS — Incorporating physical climate risks into banks’ credit risk models (2025)“...standard setting bodies and financial regulators have increasingly urged banks to recognise physical climate risk as a new factor in their risk space and internalise it in their credit risk management policies.”“...account for physical risks in banks' capital requirements, loan loss provisions...”“...Model RWA, when physical risk-related corrections are included, increases by around 7.9% [up to 20%] compared to the original calculations...”PDF]. This directly hits banking-sector profitability, forcing banks either to raise interest rates or reduce lending.
‘Uninsurable zones’ are not merely a problem for homeowners. They trigger a freeze in mortgage lending, rising credit risks for the banking system and the long-term economic decline of entire regions. These cascading, systemic effects are generally excluded from standard risk-assessment models.
Regional economic decline: affluent households and businesses leave ‘uninsurable’ zones; the cost of capital rises, investment falls and the tax base shrinks; disasters recur without the resources needed for recovery, turning regions into depressed, subsidy-dependent areas that drain the state's overall budget.
Growing social inequality: the most vulnerable groups cannot leave and remain in deteriorating, increasingly dangerous areas; the loss of insurance and growing number of disasters exacerbate stress and mental-health problems.
06.3 · Systemic risk The state as the backstop
Some argue that the state will step in where insurers withdraw. But this assumes that the state—that is, the taxpayer—can afford to do so. That assumption is already breaking down. Covering the cost of three or four major wildfires or floods in a single year pushes public budgets to the limit. If several costly events occur in quick succession—as climate projections indicate—no government can realistically cover the damage without severe austerity or collapse. Examples include Germany's €30 billion in relief for flood victims in 2021 and Australia's rising disaster-response costs in 2020–2023.
Günther Thallinger · board member of AllianzOne of the world's largest financial services and insurance groups, 2025
Hurricane Helene struck Florida's Big Bend region in autumn 2024, becoming the strongest hurricane in the region's history. 13 days later, Hurricane Milton hit Florida, becoming one of the most intense Atlantic hurricanes. This set a record for the shortest interval between major hurricanes in Florida. Combined damage was about $113 billion [NOAA, 2025NOAA — Hurricane Costs“strongest hurricane on record to strike the Big Bend region of Florida”“Helene’s total costs were $78.7 billion.”“Total costs for Milton were $34.3 billion.”; NHC, 2025NHC — Hurricane Milton Tropical Cyclone Report“one of the strongest hurricanes of record in the Atlantic basin”“This ties Hurricane Rita of 2005 for the fourth-lowest minimum central pressure in an Atlantic hurricane.”; Moody's RMS, 2024Moody's RMS — Hurricane Milton: Live blog“Milton made landfall 13 days after Helene”“the fewest number of days between major hurricane landfalls in Florida on record”]. Three months later, the Los Angeles fire added another $65 billion to total US losses, making it the costliest fire to date [Bloomberg, 2025Bloomberg — The Climate Economy 2025 Outlook“Los Angeles wildfires in January 2025 causing $65 billion in economic costs”; Munich Re, 2026Munich Re — Wildfires and bushfires“The costliest wildfires to date ... struck the Los Angeles area in January 2025”].
06.4 Systemic risk
The World Economic Forum (WEF) report «The Global Risks Report 2026» puts the global expert view into perspective.
Long-term threat: Over a 10-year horizon, the top three positions in the ranking of the most severe global risks (by impact) are occupied exclusively by environmental threats. Their potential damage is rated more highly than that of AI or geoeconomic confrontation [WEF, 2026World Economic Forum — The Global Risks Report 2026Top 3 severe risks over 10 years: 1. Extreme weather events. 2. Biodiversity loss and ecosystem collapse. 3. Critical change to Earth systems.PDF · p. 9]:
Short-term threat: Even over a 2-year horizon, extreme weather events firmly occupy fourth place among threats to the world.
Climate change remains the leading overall risk for both experts and the general public [AXA, Future Risks Report, 2025]AXA — Future Risks Report 2025“Climate change remains the top risk overall for both experts and the general population.”.
The view that climate change is the foremost global threat over the next decade is a consensus among the world's experts. It is no longer a marginal view.
06.5 Underestimation of systemic risk
Regulators, central banks and the largest insurers have independently reached the same conclusion: climate change is a systemic risk to the entire financial system.
Systemic climate risk is acknowledged at the highest level but remains underestimated in models and prices. An environment of fragmentation and ‘polycrisis’ only magnifies it.
06.6 Supply chains
A working paper by BISThe bank for the world's central banks quantifies the ‘domino effect’ in the real economy, showing that climate risk is not a local problem but a networked virus spreading through the arteries of the global economy. A climate shock, such as a drought, in one region causes GDP to fall in another geographically distant region if the two have trade links. Municipalities whose customers are affected by drought experience GDP growth declines of 1–2 percentage points [BIS, Supply chain transmission of climate-related physical risks, 2025].
NGFSA group of central banks and supervisors, including the ECB and the Federal Reserve, established to help green the financial system models probable damage in the coming years: global GDP falls by as much as 1.0% in 2026 following extreme events in Europe and by up to 2.1% in 2027 following events in Asia. In some scenarios, persistent GDP losses reach 2.8% and unemployment rises by up to 1.7 percentage points in 2028. Supply-chain ‘bottlenecks’ can cause global GDP losses of more than 3%, while regional losses peak at 12.5% of GDP in Africa [NGFS, Short-Term Scenarios, 2025].
The effectiveness of geographic diversification is declining rapidly: an industrial company in a prosperous region is vulnerable to a drought thousands of kilometres away if it sources key components from, or sells its products to, that location.
Chapter
‘Planetary solvency’: the resilience of the economy and financial system is assessed in the same way as an insurer's solvency—against rare catastrophes (the ‘tails’), not the average projection.
06.6.1 An actuarial perspective
Actuaries are financial analysts who calculate the risk of rare but devastating events for insurers and pension funds. They have applied this approach to climate and nature: the system must withstand not the average scenario, but its ‘tail’—a low-probability catastrophe.
Actuaries call the worst such outcome ‘ruin’ —the loss of prosperity through severe socio-economic destruction. Under current policies, they assess its risk as ‘non-negligible’: unacceptably high to ignore [Planetary Solvency, 2025IFoA & University of Exeter — Planetary Solvency: finding our balance with nature (2025)"…the scale and pace of human activity has continued to drive planetary outcomes, with a non-trivial risk of ruin — the loss of prosperity due to severe societal and economic disruption."PDF · p. 8]. In quantitative terms, ‘catastrophic-to-extreme’ impacts are already considered likely by 2050 [Planetary Solvency, 2025IFoA & University of Exeter — Planetary Solvency: finding our balance with nature (2025)"the trajectory is concerning, with Catastrophic to Extreme impacts Likely or Highly Likely by 2050."PDF · p. 27], but accelerating warming could bring that point forward significantly.
‘We use the example of climate risk assessment to show why and how decision-makers may inadvertently have accepted much higher levels of risk than they assume’ [Planetary Solvency, 2025IFoA & University of Exeter — Planetary Solvency: finding our balance with nature (2025)"We use the case study of climate change risk assessments to highlight why and how policymakers may have inadvertently accepted much higher levels of risk than they think."PDF · p. 10].
The target «net zero 2050» scenario provides only a 50% chance of keeping warming below 2 °C. This scenario is the main climate target for most governments and many companies worldwide: it assumes that global CO₂ emissions reach net zero by 2050. [NGFS Scenarios PortalNetwork for Greening the Financial System — NGFS Scenarios Portal"Net Zero 2050 limits global warming to 1.5°C through stringent climate policies and innovation, reaching global net zero CO2 emissions around 2050."NGFS Scenarios Portal · Net Zero 2050 scenario; Climate Action TrackerClimate Action Tracker — CAT net zero target evaluations"around 145 countries had announced or are considering net zero targets""The countries cover close to 77% of global emissions."Climate Action Tracker · 2025; SBTi Corporate Net-Zero StandardScience Based Targets initiative — Corporate Net-Zero Standard"provides companies with the guidance and tools needed to set science-based targets aligned with reaching net-zero emissions by 2050 at the latest."SBTi · Corporate Net-Zero Standard].
Actuaries point to a logical inconsistency: society and business accept an enormous 50% risk of global climate ruin, while, by comparison, the legally permitted risk of an insurer becoming insolvent is just 0.5% [Planetary Solvency, 2025IFoA & University of Exeter — Planetary Solvency: finding our balance with nature (2025)"This probability of failure is very high when compared to … society's appetite for insurance company failure, which is set at 0.5%, a one in 200 year chance."PDF · p. 22].
Moreover, the world is not yet following even this pathway. If current trends continue, warming could reach 2.5–3 °C or more [NGFS Scenarios PortalNetwork for Greening the Financial System — NGFS Scenarios Portal"Under the NGFS Current Policies Scenario, global warming of 1.5 °C could be reached in the 2030s, 2 °C around 2050 and 3 °C around 2100.""If no further measures are introduced, 3 °C or more of warming could occur by 2100."NGFS Scenarios Portal · Current Policies scenario]. Yet such projections are based on average estimates, while an overlooked extreme-warming scenario of 4.5 °C or more has an 18% probability.
06.6.2 Climate tail risks
Between +1,5 °C and +2 °C climate damage begins to exceed total annual global GDP growth (about 3% per year) [Parasol Lost, 2026IFoA & University of Exeter — Parasol Lost: Recovery plan needed (2026)"climate damages increasing rapidly above 1.5°C of warming and overwhelming the global GDP growth rate of 3% per annum, between that temperature and 2°C of warming."PDF · p. 20]. Beyond that, losses accelerate: about 30% of GDP at +3 °C and up to 80% at +4 °C [Climate Scorpion, 2024IFoA & University of Exeter — Climate Scorpion: the sting is in the tail (2024)"around 30% GDP loss occurs at 3°C of warming, compared with 80% GDP loss using the 4°C ruin parameterisation.""this is purely an illustrative example."PDF · p. 28]. These mathematical damage models are intended to illustrate the dynamics of rapidly compounding losses, not to provide a precise economic forecast.
06.6.3 Breaching planetary boundaries
‘Planetary boundaries’ are safe limits for nine Earth systems, including climate, freshwater and biosphere integrity. By 2025, 7 of the 9 had been breached, compared with 6 in 2023 [Tipping into the wild unknown, 2026IFoA & Anglia Ruskin University — Planetary Solvency: Tipping into the wild unknown (2026)"9 boundaries assessed / 7 crossed"PDF · p. 10 (Figure 1)]. The key difference from ordinary risk is that recovery beyond a tipping point cannot be assumed: this is ‘not a risk of volatility, but of irreversibility’ [Tipping into the wild unknown, 2026IFoA & Anglia Ruskin University — Planetary Solvency: Tipping into the wild unknown (2026)"Beyond a tipping point, recovery cannot be assumed to be possible … The risk is not just volatility, it is irreversibility."PDF · p. 9]. Breaching these limits deprives humanity of a safe operating space and sharply increases the risk of sudden ecosystem collapse [HM Government, 2025Global biodiversity loss, ecosystem collapse and national security (2025)“As of 2023, six boundaries have been crossed: (1) biosphere integrity... (6) novel entities...”PDF · p. 6]. Many of nature's services are irreplaceable: they cannot simply be ‘bought back’ [Planetary Solvency, 2025IFoA & University of Exeter — Planetary Solvency: finding our balance with nature (2025)"Ecosystem services are often non-substitutable … their loss undermines economic production."PDF · p. 11].
Each risk is plotted on two axes—‘how severe’ (from ‘limited’ to ‘extreme’) and ‘how likely’—showing its position in 2025 and trajectory towards 2050.
Where we are in 2025. The risk position rose sharply over the year and moved beyond acceptable levels. Climate is at the ‘severe’ level; nature is expected to reach ‘severe’ in the near term. Social fragmentation is growing, with active conflicts, geopolitical tension and pressure on vulnerable states. Economic losses and mortality remain ‘limited’ for now.
Where we are heading. The trajectory pushes every risk further beyond acceptable levels; breaches of risk tolerance are likely. Immediate policy action is needed to reduce the risk of ‘catastrophic’ impacts or worse—within this century and possibly well before 2050 [Global Tipping Points: Planetary SolvencyGlobal Tipping Points — Planetary Solvency Dashboardglobal-tipping-points.org].
1 · Climate now: high trend: critical
2 · Nature now: high trend: critical
3 · Society now: moderate trend: high
4 · Economy now: low trend: high
Climate and nature are no longer a distant scenario but a tail risk now materialising, which actuaries assess as a non-negligible risk of ‘ruin’—a breach of solvency limits. Warming is at the threshold of 1.5 °C and accelerating; the loss of the aerosol ‘umbrella’ could sharply accelerate it, while tipping points already crossed—reefs, soils and forests—are irreversible. Financial models that assume mean reversion after a shock understate this risk; at the macroeconomic level, its scale is comparable to a systemic financial crisis within the coming decade.
Chapter
Reducing losses requires vast investment in physical protection and infrastructure adaptation. Yet the world is ‘running out of resources’: it is preparing for climate change but lacks the means to achieve resilience [UNEP AGR, 2025UNEP — Adaptation Gap Report 2025 (2025)“Action on adaptation is still inadequate.”PDF · p. 1].
The current pathway, based on legislation already enacted, is leading the world towards warming of +3 °C — +3,8 °C [NGFS, Phase V, 2024]NGFSA group of central banks and supervisors, including the ECB and the Federal Reserve, established to help green the financial system — Climate Scenarios for central banks and supervisors, Phase V (2024)“Current Policies assumes that only currently implemented policies are preserved, leading to high physical risks”“Current Policies 3.0 °C”. This is a dual systemic failure: a lack of political will to mitigate warming by reducing GHG emissions, and a vast funding shortfall for adaptation—protection against climate risks already embedded in the system.
Despite political declarations, a structural energy transition is not yet under way. Data from the 2025 Lancet Countdown report reveal a paradox: amid record climate threats, the global community continues to invest in the factors causing those threats.
Meanwhile, humanity is missing the enormous health benefits of decarbonisation: phasing out coal could prevent 1 million deaths every year [Lancet Countdown, 2025The 2025 report of the Lancet Countdown on health and climate change“1·00 million annual deaths were still attributable to coal combustion globally in 2022”PDF · p. 26].
Adaptation is not optional but a condition for survival, yet global investment in it is grossly inadequate [Allianz, Research Climate Adaptation Report, 2025Allianz — Rethinking climate adaptation for global resilience (2025)“adaptation finance remains severely underfunded … Adaptation is no longer an option; it is a survival”].
Even wealthy countries can no longer adapt their own infrastructure fast enough: climate risks are growing faster than budgets, projects and governance systems.
In the UK, the official independent body established by law to assess climate policy and report to Parliament judged the country's preparedness for climate risks in 2025 to be inadequate: it found not a single area of adaptation delivery that could be rated ‘good’. [CCCClimate Change Committee — About“The Climate Change Committee (CCC) is an independent, statutory body established under the Climate Change Act 2008.”“...to report to Parliament on progress made in... preparing for and adapting to the impacts of climate change.”Official website; CCC, 2025Progress in adapting to climate change: 2025 report to Parliament“The UK’s preparations for climate change are inadequate.”“In terms of adaptation delivery, we do not find evidence to score a single outcome as ‘good’.”PDF · 2025 report to Parliament].
New York already faces growing risks from heat, coastal storms and extreme rainfall. About 2.5 million residents live in the 100-year floodplain. The FiDi-Seaport protection project alone is estimated to cost $5.5 billion in 2025 prices; if construction begins in 2029, its cost could rise to $8–9 billion. The city explicitly states that no single source of funding is sufficient for a project of this scale [NYC ComptrollerNYC Climate Dashboard — Resiliency“Today, nearly 2.5 million New Yorkers live in the 100-year floodplain.”Website; FiDi-Seaport Climate Resilience PlanImplementation — Project Cost“The estimated capital cost ... is $5.5 billion in 2025 dollars.”“...with escalation, the total project cost will be an estimated $8-9 billion.”“no single funding stream would be sufficient”Website · Implementation].
Adaptation action ‘remains inadequate’, while the finance needed for it is ‘woefully inadequate’ [UNEP AGR, 2025UNEP — Adaptation Gap Report 2025 (2025)“Action on adaptation is still inadequate.”PDF · p. 4; UNEP AGR, 2025UNEP — Adaptation Gap Report 2025 (2025)“the financial resources needed to enable adaptation action in developing countries at the scale necessary to meet the growing challenges of current and future climate risks is woefully inadequate.”PDF · p. 10]. The gap between needs and actual finance is not narrowing [UNEP AGR, 2025UNEP — Adaptation Gap Report 2025: Running on empty (2025)“The adaptation finance gap is not reducing, and the Glasgow Climate Pact goal will be missed under current trajectories.”PDF · p. 7].
The global economy is critically unprepared for climate impacts that are already locked in. This vast adaptation deficit creates colossal systemic risk.
Beyond the financing gap, the implementation of adaptation measures faces a number of systemic constraints:
Historically, social mobilisation on this scale occurs in response to an obvious and immediate threat to survival. Yet the nature of climate change means that the level of danger and the scale of the threat will probably be felt and widely recognised much later.
Part 7
Inevitable, sudden and two-sided · real estate · mispricing the world’s largest asset class · ‘Minsky moment’ · modelling BISThe bank for the world's central banks
07.1 Inevitable · sudden · two-sided
Markets currently ignore physical risks, creating a ‘climate bubble’ in asset prices. A correction is inevitable and is unlikely to be smooth.
Negative repricing (loss of value): will affect assets whose profitability depends on a stable climate and geographical location — real estate in flood and wildfire zones, agriculture in drought-prone regions and outdated infrastructure — as well as sectors linked to the main sources of GHG emissions (fossil fuels and agriculture)
Positive repricing (increase in value): capital will seek ‘climate havens’. Assets that provide resilience will appreciate: providers of adaptation solutions (clean energy, energy-efficient materials and water technologies), companies with climate-resilient business models and real estate in safe regions.
The question is not whether repricing will happen, but when it will happen and which side your capital will be on. Ignoring this risk means betting that the ‘bubble’ will not burst. A viable strategy is to invest in assets that will benefit from this repricing. At the same time, the foundation of every strategy should be mitigating impacts worldwide (reducing emissions) and adapting to them.
07.2 Real estate
From sharp declines in house prices to insurance problems, climate change is already affecting real estate markets worldwide. Climate-related risks became ‘a deciding factor in home-buying decisions’ for more than 80% of prospective buyers on Zillow [Zillow, 2024]. Tellingly, 14 months later Zillow hid the feature from its website following complaints from estate agents and homeowners that it was hurting sales.
In regions where climate risks are already materialising or are projected to do so in the future, real estate risks losing its status as a safe-haven asset.
07.3 Mispricing the largest asset class
The models the market relies on systematically understate climate risk, so key assets may be mispriced:
Risks are underestimated at every level. Assets may be repriced if they are valued without accounting for actual cascading damage: European investors are exposed not only to drought in Spain, but also to flooding in Thailand (through supply chains) or a hurricane in Florida (through catastrophe bonds). The system appears to be permeated by cascading risks, many of which remain difficult to measure.
07.4 Modelling BISThe bank for the world's central banks · ‘Climate Minsky Moment’
The mechanism of a ‘Climate Minsky Moment’: an abrupt tightening of climate policy (for example, a high carbon tax) devalues assets in ‘dirty’ sectors (such as fossil fuel extraction, conventional energy and heavy industry); banks that hold these assets or have lent against them suffer a decline in capital, triggering panic and fire sales and potentially leading to a deep crisis.
However, BISThe bank for the world's central banks states: ‘our results firmly reject the idea that financial stability considerations provide a valid reason to delay the transition to net zero’. Delaying is more dangerous — it only increases the scale of the future shock.
Annual probability of a systemic financial crisis (model by BISThe bank for the world's central banks)
[BIS, Charts 1–2, pp. 21–22]
When the world’s largest and most conservative investors — central banks — begin systematically selling some assets and buying others, this can create a powerful long-term trend. Failing to account for climate risks puts a portfolio at odds with central-bank strategies: their actions to ‘green’ reserves may exert systemic pressure on the market, potentially raising the value of ‘green’ assets and reducing the appeal of ‘dirty’ ones.
Part 8
Rating agencies and auditors: how climate considerations are being incorporated into credit analysis and mandatory financial reporting.
08.1 Rating agencies
Major agencies are building a methodological framework and beginning to apply it, but label their analyses as ‘research’ because of the high degree of uncertainty. New scenario-analysis methods are needed, as this approach ‘can provide insight into possible outcomes and identify potential vulnerabilities’ [S&P Global, 2025S&P Global — Credit FAQ: How the Global Climate Policy Pendulum Could Affect Our Ratings (2025)“provide insight on possible outcomes … highlight potential vulnerabilities”]; ‘the current model does not capture the full scope of future threats’ [Fitch, SCVS, 2025Fitch — Sovereign Climate Vulnerability Signals / SCVS (2025)“SRM will not necessarily fully capture climate risks … full impact ... has not yet materialised”].
Fitch has published a ‘discussion paper’ — a roadmap for assessing the impact of physical climate risks on sovereign ratings — sending the market a clear signal that it is developing a tool that will systematically identify vulnerable countries [Fitch, SCVS, 2025]Fitch — Sovereign Climate Vulnerability Signals / SCVS (2025)“use Climate.VS as a screening tool … does not necessarily mean it will result in a downgrade”. The market will be forced to reprice when agencies begin systematic downgrades — for example, when a series of major disasters makes physical risks obvious and undeniable. We are on the threshold of that moment.
Leading rating agencies publicly state that new methodologies are needed because their current models cannot fully assess future climate risks. This signals that some risks are not yet fully reflected in current credit ratings or asset prices.
08.2 Auditors and new standards
The market will reprice companies based not only on profitability, but also on the quality of their climate reporting and the resilience of their business models.
Regulators are beginning to require companies to assess and disclose both how they affect the climate and how climate risks affect them; the process is phased and will expand [Moody's, 2025Moody's — Climate Pathways (2025)“regulatory bodies globally are broadening climate disclosure requirements … company’s impact on climate change and climate change’s impact on the company”; Deloitte, 2024Deloitte — Sustainability and Climate Risk Assessment (2024)“regulatory disclosure requirements such as those from the TCFD, ISSB, and CSRD”]. Investors increasingly expect climate risks to be accounted for in financial statements, challenging the widespread assumption that climate change has no material, quantifiable impact on the valuation of assets and liabilities [KPMG, 2025]KPMG — On the 2025 audit committee agenda (2025)“Regulators, investors … increasingly expecting companies to consider climate risks when preparing their financial statements”.
‘The introduction of the new IFRS S1 (sustainability-related disclosures) and S2 (focused exclusively on climate-related disclosures) standards is being described as a generational shift in financial reporting’ — a fundamental change that is already under way [EY, 2025EY — Good Group: Illustrative climate-related disclosures (2025)“referred to as a generational change in financial reporting … IFRS S1 … IFRS S2”]. Audit committees must assess how climate risks (physical and transition) affect the value of assets and liabilities; climate-related and conventional reporting data must be aligned [KPMG, 2025KPMG — On the 2025 audit committee agenda (2025)“Regulators, investors and other bodies are increasingly expecting companies to consider climate risks when preparing their financial statements”; PwC, 2024PwC — The impact of climate change on financial statements (2024)“assessed the impact of climate change on measurement of assets and liabilities”“significant judgements and estimates ... climate-related risk”; EY, 2025EY — Applying IFRS: Accounting considerations for climate-related matters (2025)“measurement and disclosure of climate-related matters”“climate risk ... may impact a number of areas of accounting”“fair value measurements ... consider the relevant climate-related risk factors”].
The standards are rapidly becoming mandatory: 30 jurisdictions are already adopting ISSB S1/S2; together they account for almost 57% of global GDP. Companies will have to disclose Scope 1, 2 and 3 emissions; non-compliance means fines and a higher cost of capital [BIS, Climate-aware investing, 2025].
Indicative timelines for mandatory climate reporting:
08.3 Repricing through compliance
The entire system of International Financial Reporting Standards (IFRS), reinforced by the IFRS Foundation’s S1 and S2 requirements, now aims to compel companies to quantify climate risks and reflect them on their balance sheets through specific accounting procedures (impairment, remeasurement of liabilities and credit-loss provisions). Regulators, banks, auditors and asset managers will require, scrutinise and challenge climate-related estimates and assumptions — these risks can no longer be ignored on balance sheets.
Likely consequences:
When companies, under pressure from auditors and regulators, begin to acknowledge that their factories, infrastructure and other assets are worth less because of climate risks (or accelerate climate change through their emissions), this could materially affect their capital and share prices. By contrast, companies that demonstrate low vulnerability to climate and energy-transition risks, as well as the least negative impact on the climate, may rise in value. Companies that cannot provide reliable, audited data at all are also likely to be penalised by the market. The market has not yet repriced these risks because most companies have not reflected them in their financial statements; new disclosure rules and audit requirements may trigger this repricing in the coming years.
Investors’ expectations regarding climate scenarios affect the cost of capital and companies’ investment decisions [EUCRA, 2024European Environment Agency — European Climate Risk Assessment (2024), ch. 17“Investors' expectations on the realisation of climate scenarios affect the cost of capital and thus firms' investment decisions…”Website]. If climate risks have gone undisclosed for a long time, the first comprehensive disclosure or a major disaster could trigger sharp asset repricing. In such a situation, urgent sell-offs (fire sales) are particularly damaging to investor returns [EUCRA, 2024European Environment Agency — European Climate Risk Assessment (2024), ch. 17“Fire sales can be particularly harmful to investors' returns…”Website], while financial links among banks, funds and insurance companies (cross-shareholdings, loans and deposits) increase the risk of a chain reaction (contagion) [European Commission, 2024European Commission (2024)Investment funds and insurers are closely linked to the banking sector through cross-shareholdings, loans, common exposures and deposits.]. A similar mechanism underpinned the 2008 crisis.
There is a narrowing window before risks are reflected in credit spreads and market prices: a viable strategy is to exit assets destined to become ‘toxic’ early and move into those that will benefit from repricing.
Part 9
Two divides — latitudinal and wealth-based · regional matrix · the case of Cyprus
09.1 Introduction · geography of risk
Climate risks and impacts are distributed extremely unevenly around the world, and each region requires its own detailed analysis. The broad pattern comes down to two divides.
At the same time, regions are linked by a shared atmospheric system: for example, the disruption of the stratospheric polar vortex over the Arctic intensified extreme rainfall in southern China [Arctic stratospheric polar vortex collapse amplified South China extreme rainfall, 2025]. There are no completely isolated, ‘safe’ countries — climate change affects every country to some extent.
09.1 Introduction · geography of risk
Europe is unprepared for rapidly accelerating climate risks, several of which have already reached critical levels. Policy action is lagging far behind the pace at which the threats are growing [EEA, EUCRA, 2024].
The greatest economic damage comes not from one-off disasters but from persistent, chronic impacts of climate change: recurring heatwaves, lost working hours and rising energy costs for cooling buildings and critical infrastructure such as data centres [JRC]. For example, in 2022 the temperature in the UK exceeded 40°C for the first time on record: railway tracks buckled and runways melted [JRC PESETA V, 2025JRC — Regional economic climate risks in Europe (2025)], because much of Europe's infrastructure was designed for the former climate, and every climate record subjects it to stresses it was not built to withstand.
A climate-driven shift in economic activity is under way: tourism is moving north, while agriculture in the south, on which the rest of Europe partly depends, faces an existential threat. This is creating both clear losers and potential, less obvious winners.
Climate change amplifies economic inequality. The greatest damage will fall on already more vulnerable coastal, Mediterranean and Eastern European regions [JRC]. Poorer regions with ageing populations and a dependence on ‘dirty’ industries may face a ‘perfect storm’ in which physical shocks trigger severe social and economic crises, increasing credit and sovereign risks.
A strategy of investing in ‘Europe’ as a single asset no longer works. The climate transition requires a fundamental repricing of regional risks.
Adaptation policy is becoming a prerequisite for the financial stability of vulnerable regions; those that fail to adapt will face a risk of financial destabilisation [JRC, PESETA V, 2025].
| Region | Key threats | Already happening +1.5° | Outlook +2° / +3° | Financial implications |
|---|---|---|---|---|
| US | Droughts and wildfires, hurricanes, severe convective storms (tornadoes, hail) | The world's highest absolute losses; droughts, fires, hurricanes and floods remain among the main channels of damage [Bloomberg, 2025] | By mid-century: PIK estimates a median income decline of about −8% for North America; NBER estimates the peak regional effect of a global temperature shock at close to −10% for North America and Europe [NBER, 2026NBER (revised) — The Macroeconomic Impact of Climate Change: Global vs. Local Temperature (2026)“The peak effect in North America and in Europe is near −10%, albeit not very precisely estimated.”; PIK revised version, 2025PIK — The economic commitment of climate change, revised (2025)“permanent income reduction for the majority of regions, including North America and Europe (with median income reductions of approximately 8 and 7% respectively)”] | ‘Uninsurable zones’ are already a reality (California, Florida); migration and development continue into high-risk areas |
| Mid-latitudes of the Northern Hemisphere | Concurrent heatwaves, compound heat and drought, synchronous agricultural shocks | Over the 1979–2019 period, the frequency of concurrent heatwaves increased by a factor of 6, their average spatial extent by 46% and their maximum intensity by 17% [FAO & WMO, 2026] | Compound ‘extreme heat + drought’ events have already become more severe; by 2081–2100, their frequency across most land areas may increase by 200–300% relative to 1986–2005 [FAO & WMO, 2026] | Diversifying supplies ‘by region’ loses some of its protective value if several breadbaskets are hit simultaneously |
| Southern Europe | Heat, droughts, water scarcity, fires | The impact of heatwaves on GDP reaches −1.1–1.4 percentage points [Allianz, 2025Allianz — Heatwaves: Economic ImplicationsWebsite]; about 30% of Southern Europe's population lives in regions already facing chronic water scarcity; in summer, this share rises to about 70% [EEAEEA — Use of freshwater resources in EuropeWebsite] | At +2 °C: river flow on low-flow days −40% (southern Spain, Portugal, Greece and France) [EEA, EUCRA, 2024EEA — European Climate Risk Assessment, EUCRA (2024)PDF · Chapter 5, p. 129]; at +3 °C the risk to people and the economy becomes ‘catastrophic’ [EEA, EUCRA, 2024EEA — European Climate Risk Assessment, EUCRA (2024)]; heat that occurs ‘once every 50 years’ — almost every year in Spain and parts of Portugal [JRC PESETA IV, 2020JRC PESETA IV — Heat and cold extremes (2020)“In a 3°C warmer climate compared to pre-industrial times, a current 50-year heatwave may occur almost every year in Spain and parts of Portugal, every 3 years in most other southern European areas and at least every 5 years in other regions of Europe.”“At 2°C, this further grows to 172 million/year.”PDF · p. 3] | Agriculture and tourism — pillars of the economy — depend directly on water; risk of ‘hard limits to adaptation’ |
| Central and Western Europe | River flooding (50% of all weather-related losses [Swiss Re, 2024]), heat, low river levels, megadroughts | 2021 floods (Germany/Belgium): €44 billion; Rhine, 2018: 132 days of shipping disruption, −0.4% of German GDP [EEA, EUCRA, 2024EEA — European Climate Risk Assessment, EUCRA (2024); JRC Atlas] | Water scarcity is spreading to the EU's industrial core; coastal flooding at +3 °C — more than €1 trillion a year [EEA, EUCRA, 2024EEA — European Climate Risk Assessment, EUCRA (2024)] | Ageing infrastructure designed for the former climate; logistics depend on rivers (Rhine, Danube) |
| Northern Europe | Droughts (a new phenomenon), floods, storms | 2018: Scandinavian hydropower below normal, water shortages even in Finland and Sweden [EEA, EUCRA, 2024EEA — European Climate Risk Assessment, EUCRA (2024)]; Scotland-2025: reservoir levels 40% below normal; UK-2022: 40 °C for the first time | Summer rainfall in England: −15% by the 2050s, −22% by the 2080s [Open University → EEA, EUCRA, 2024EEA — European Climate Risk Assessment, EUCRA (2024)] | The ‘illusion of a safe North’ has been dispelled: infrastructure was not designed for drought, and damage in ‘unexpected’ places is disproportionately high |
| Eastern Europe | Floods, heat, ‘carbon traps’, air pollution | Romania, Latvia and Bulgaria are among the 5 EU countries with the highest average annual flood losses; damage from major events reaches 7–17% of GDP [World Bank, 2021World Bank — Economics for Disaster Prevention and Preparedness in EuropeWebsite] | Rising credit and sovereign risks due to the combination of physical shocks and transition costs [JRC] | |
| Emerging economies | Heat, droughts, floods, cyclones | Insurance gap: 94% of losses in China, 93% in India and 83% in South Africa are uninsured [Allianz, 2025]; India: 82% of newly irrigated land is in water-scarce areas [Nature Water, 2024] | Regional sequences of extreme events: losses of up to 12.5% of GDP (Africa) [NGFS, 2025]; by 2050, droughts may affect more than three-quarters of the world's population [UNDRR, 2025] | Almost all losses are borne by public budgets and households; access to capital for adaptation is limited |
Regional case study
09.2.1 Case study: Cyprus
Note: There are still no comprehensive models capable of accounting for all cross-system and cascading effects (spillover effects). The reality may therefore be more severe: climate processes may unfold faster, reach higher levels of intensity and be accompanied by phenomena not previously accounted for.
The Mediterranean region, like Europe as a whole, is warming at 2× the global average rate [Cyprus NASCyprus National Adaptation Strategy“EMME is warming nearly twice as fast as the global average especially during summer, while alterations in the hydrological cycle, primarily through reduced precipitation, have become increasingly evident.”PDF · p. 26]. Major climate risks, including wildfires, floods, water scarcity and coastal erosion, are already damaging Cyprus's biodiversity, agriculture, aquaculture and fisheries, underscoring the urgent need for stronger prevention measures [European CommissionEuropean Commission — Country Report: Cyprus“Significant climate risks (e.g. wildfires, floods, water scarcity and coastal erosion) are harming Cyprus’s biodiversity, agriculture, aquaculture and fisheries sector, thus underscoring the urgent need for improved prevention.”Website].
Night-time heat hinders physical recovery, increasing health risks for residents and tourists.
Rising temperatures have affected the island unevenly. In Nicosia (centre), Larnaca (south) and Polis Chrysochous (north), a sharp increase in the number of hot days (>35 °C) has been recorded relative to the 1986–2005 baseline. In mountainous Agros the increase is also significant, though less pronounced. By contrast, in Paphos (west) and mountainous Prodromos only a slight increase has been recorded.
Cyprus faces a significant and steadily rising wildfire risk. The island has the highest level of fire danger among all Mediterranean islands and ranks second in Europe for burnt area as a share of its territory. The probability of weather conditions that could cause fires threatening life and property is estimated at more than 50% in any given year [World Bank, 2024World Bank Group: Country Climate and Development Report for Cyprus (2024)“Cyprus faces a significant and increasing risk of wildfires... Cyprus faces the highest wildfire danger among Mediterranean islands and ranks second in Europe for burned area per land mass... The likelihood of weather conditions leading to wildfires that can cause loss of life and property is estimated to be greater than 50 percent in any given year.”Link].
Climate change has already made extreme fire weather conditions (FWI) in Cyprus 10× as likely [State of Wildfires 2024-25State of Wildfires 2024-25“FWI values recorded in Türkiye, Cyprus and Greece were 10 times more likely due to climate change. The FWI values recorded in Spain and Portugal were 40 times more likely...”PDF · p. 41].
In 2025, Cyprus experienced the worst fire season in its history. It was marked by extreme conditions, including a severe heatwave and dry weather. As a result, an area almost the size of Nicosia [2026 Country Report2026 Country Report - Cyprus“The 2025 wildfire season in Cyprus was marked by extreme conditions (including a severe heatwave and dry weather) that resulted in the worst wildfire in Cyprus’s history, burning an area almost as large as Nicosia.”PDF · 2026]was burnt. Around 900 private propertieswere destroyed, and total direct damage is estimated at €252.68 million [European CommissionEuropean Commission — Mobilisation of the European Union Solidarity Fund, COM(2026) 1002 final“The Cypriot authorities estimate the total direct damage caused by the disaster at EUR 253.69 million. The Commission accepted EUR 252.68 million as plausible total direct damage.”“Several schools and health establishments had to reduce their services and close to 900 private properties were destroyed.”PDF · 18 May 2026].
The events of 2025 continue a trend of escalating risk:
Cyprus already faces acute, chronic water scarcity, and its water exploitation index is the highest in the EU [Country ReportEuropean Commission — Country Report: Cyprus“Cyprus faces severe, chronic water scarcity and its water exploitation index indicates the highest pressure in the EU as a whole.”PDF]. Meanwhile, droughts and water scarcity will only worsen, placing extreme pressure on the population and infrastructure [EPRS, 2025European Parliamentary Research Service (Feb 2025)“Water scarcity and drought in particular are expected to worsen, putting further pressure on human life and ecosystems... lack of sustainable water management to build resilient agriculture is of particular concern.”PDF · pp. 2, 4]. The rapid physical depletion of natural water resources is therefore a key risk.
In 2026, reservoir levels reached their lowest point in the 125-year observational record even before the tourist season began [Copernicus, 2026EU Space: Copernicus Image of the Day“Severe drought in Cyprus, February 2026”Website]. The authorities urged the public to cut water consumption by 10%, while the 2026 allocation of water for agricultural irrigation was reduced by one-third [Euronews, 2026Euronews“Cyprus water emergency: citizens urged to reduce water use as dams reach record low” (Jan 2026).Website].
The country has shifted almost entirely to desalination: around 80% of all drinking water on the island — up to 245 thousand cubic metres per day — is supplied by energy-intensive desalination plants [WDD CyprusWater Development Department (Ministry of Agriculture, Cyprus)Official data: Permanent and mobile desalination plants now cover approx. 80% of the island's drinking water needs.]. Desalination is critically dependent on electricity, creating a potential cascading risk.
Electricity is not a sector; it is the backbone of Cyprus: building cooling, water supply, desalination, pumps, hospitals, communications, hotels and trade all depend on it. A climate shock to the energy system therefore quickly becomes a shock to several sectors at once [EEAEuropean Environment Agency — Climate risks in energy systems“A stable and affordable energy supply is central for a modern society — Risks to energy supply can cascade to all societal sectors and activities, threatening security, economic well-being, and human health.”PDF · 2024].
Cyprus remains the only EU member state isolated from the internal energy market. At times of peak demand or a capacity shortfall, it cannot import electricity from a neighbouring grid.
The country's entire energy base depends on imported fuel. A price or logistics shock affecting oil can spread across the entire energy-dependent system. Cyprus is one of the EU member states most dependent on oil
All three plants account for 83% of installed capacity. This leaves the system poorly diversified.
This is dangerous for an isolated grid: when the island needs maximum capacity, the system's reserve capacity may disappear.
During the 2025 heatwave, electricity demand in Europe jumped by as much as 14%, exceeded normal peaks and became one of the factors behind outages in Italy [WRIWorld Resources Institute — Europe’s Soaring Heat and the Air Conditioning Dilemma“During the June and July 2025 heat wave... electricity demand in some parts of Europe spiked by as much as 14%, peaking above typical winter levels and contributing to outages in countries like Italy.”Website · 2025].
In 2025, rising load on Cyprus's grid amid the heat could have led to rolling blackouts because reserve capacity was insufficient [StockWatch / CNAStockWatch — Cyprus Faces Tight Power Supply Amid Heatwave“...the system is operating on a low operational margin, meaning that any further loss of conventional production could pose a risk of supply shortages.”“In such a case... rotational cuts of consumer load will be necessary...”Website · 23 July 2025].
Heat increases the risk of technical failures and accidents, while marine heatwaves may impair cooling at thermal power plants and force them to curtail generation [StockWatch / CNAStockWatch — Cyprus Faces Tight Power Supply Amid Heatwave“...any further loss of conventional production could pose a risk of supply shortages.”“In such a case... rotational cuts of consumer load will be necessary...”Website · 23 July 2025; EIBEIB — Vasilikos Power Plant“The cooling for the heat exchanger is provided by once through cooling water abstracted from the sea and subsequently returned to the sea at higher temperature.”PDF · p. 8; EEAEuropean Environment Agency — Cooling buildings sustainably in Europe“...limited supply of cooling water for thermal power generation... could pose risks of power outages.”Website · 2022].
Rising air temperatures, a thermal power plant failure or a marine heatwave could lead to rolling blackouts [StockWatch / CNAStockWatch — Cyprus Faces Tight Power Supply Amid Heatwave“...the system is operating on a low operational margin, meaning that any further loss of conventional production could pose a risk of supply shortages.”“In such a case... rotational cuts of consumer load will be necessary...”Website · 23 July 2025; EEAEuropean Environment Agency — Cooling buildings sustainably in Europe“...limited supply of cooling water for thermal power generation... could pose risks of power outages.”Website · 2022].
The problem extends beyond electricity: the very systems needed during heat and drought are put at risk.
Cyprus's drinking water already depends on desalination. Desalination, in turn, is an energy-intensive process that depends directly on the power grid [IEEPIEEP — Water Pricing in Cyprus“...these plants also require large amounts of electricity to produce freshwater...”PDF · Cyprus water pricing].
Cooling is already a major energy load in Cyprus. During hot weather, this increases the risk of indoor overheating as well as demand for healthcare and electricity [ImperialImperial Grantham Institute — European heatwave 2025“...increased risk of overheating of indoor environments. All of this comes with an increasing high demand for health services and increased power demand.”PDF · p. 5].
Power-supply risk spills into other sectors: such failures threaten safety, economic well-being and health [EEAEuropean Environment Agency — Climate risks in energy systems“Risks to energy supply can cascade to all societal sectors and activities, threatening security, economic well-being, and human health.”PDF · 2024].
Water and energy systems depend on climatic conditions and have virtually no spare capacity. An energy failure in Cyprus could therefore become a water, sanitation, tourism and operational failure all at once.
Cyprus will face significant temperature increases and declining precipitation in both the near and distant future. [Cyprus NASCyprus National Adaptation Strategy“Cyprus is projected to experience significant increases in temperature and decreases in precipitation in both the near (2041-2060) and distant (2081-2100) future.”PDF · p. 26]
Cyprus has no strong domestic food buffer: agriculture is already constrained by water scarcity and heat, while food imports depend on external suppliers, including Greece and Italy [2026 Country ReportEuropean Commission — 2026 Country Report: Cyprus“The agricultural sector is challenged by water scarcity and heat stress, which are impacting crop yields and food security.”PDF · p. 81; WITSWorld Bank WITS — Cyprus Food Products Imports by country, 2023“In 2023, the top partner countries from which Cyprus Imports Food Products include Greece, Italy, Germany, United Kingdom and Argentina.”Website · 2023].
Imports do not eliminate the risk: Cyprus's key food suppliers include Greece and Italy, which are in the same climate-vulnerable Mediterranean region [WITSWorld Bank WITS — Cyprus Food Products Imports by country, 2023“In 2023, the top partner countries from which Cyprus Imports Food Products include Greece, Italy, Germany, United Kingdom and Argentina.”Website · 2023; JRCJoint Research Centre — Climate impacts on the Water-Energy-Food-Ecosystem nexus in Europe“The Mediterranean region faces significant challenges in meeting irrigation demands in current climate (1981-2010), leading to increasing water scarcity and stress.”PDF · 2026]. Climate change is expected to reduce crop yields in other regions as well; there is also a risk of global food shocks. (See the Food chapter).
Local production losses are substantial: Cyprus is among the EU areas experiencing the largest relative declines in wheat yields due to drought, alongside Spain, Romania and southern Italy. Heat and water scarcity are already reducing crop yields, raising costs and threatening food security [European Commission, 2026Cyprus 2026 Country Report (SWD(2026) 213)“Heat and water stress are already reducing yields, increasing costs, and threatening food security...”PDF] [EEA, 2025Europe’s environment and climate: state and outlook 2025“Significant reductions in yields of wheat due to droughts are projected at 2°C of warming, with the highest reductions in percentage terms expected in Spain, Romania, southern Italy and Cyprus.”PDF · p. 37].
This double physical shortage — locally and among suppliers — could therefore translate into significant inflation. As a result, Cyprus is expected to see one of the EU's largest increases in household food expenditure, and — alongside Greece — the largest increase in healthcare expenditure due to climate change [EPRS, 2025European Parliamentary Research Service (Feb 2025)“A study on the cost of climate change... estimates that the highest increase in climate-induced health expenditure is expected to occur in Cyprus, as well as in Greece. Cyprus is also among the countries with the highest increase expected in household food expenditure.”PDF · p. 6].
Tourism is a vital pillar of Cyprus's economy: around 20% of GDP is linked to the sector directly or indirectly [Trade.govU.S. International Trade Administration“Travel and tourism-related activities generate approximately 20 percent of ROC GDP” (2026).Website]. Yet the sector depends critically on coastal ecosystems, which are now degrading rapidly. More than 90% of tourists choose coastal towns, while pronounced seasonal peaks significantly intensify water stress and overload infrastructure [2026 Country ReportEuropean Commission — 2026 Country Report: Cyprus“Coastal tourism is highly seasonal, leading to environmental degradation, water stress, and infrastructure overload during peak months...”PDF · p. 109].
In addition to extreme heat and freshwater scarcity, sea-level rise and the associated coastal erosion pose a physical threat to tourism in Cyprus. Coastal infrastructure in Cyprus is not yet subject to systematic climate assessment, even though sea-level rise is projected to cause annual losses of up to 0.4% of GDP by 2050; timely adaptation could reduce these losses by 90% [EEAEuropean Environment Agency“The rising sea levels are projected to cause annual economic losses of up to 0.4% of gross domestic product by 2050. Strategic adaptation measures... could reduce these losses by up to 90%.”Website].
Under the +2 °C scenario, Cyprus ranks first for economic damage among all 27 EU member states [JRC PESETA V, 2025JRC — Regional economic climate risks in Europe (2025)“A significant proportion of the population (more than 75%) in countries such as Greece, Cyprus, and Croatia are expected to suffer significant losses both of GDP and consumption.”“Countries are ordered by their average losses in the baseline.” (Figure 4, CY is far left)PDF · p. 13]. A report by the JRCEuropean Commission's Joint Research Centre divides the damage into two indicators: GDP decline (overall economic activity) and decline in consumption (a real fall in living standards and welfare, because unavoidable spending, such as repairing infrastructure after disasters, increases GDP but directly reduces household incomes). The charts show the following levels of risk to the population:
Model limitations:
Cumulative discounted losses to the island's economy by 2050, based on a scenario in which +2 °C is reached by 2050 (this threshold and the associated damage may arrive considerably earlier):
Impact on the population: household spending on food, healthcare and electricity is projected to rise sharply. Cyprus is expected to become one of the EU countries where vulnerable groups are hit hardest [Cyprus Institute, 2025The Cyprus Institute — Policy Brief (2025)“Cyprus is expected to be one of the countries with the strongest negative impacts on vulnerable households due to climate change. Household expenditure on food, electricity and health services are projected to increase...”PDF · p. 8].
In addition to macroeconomic risks, investors face a direct physical threat to assets:
Cyprus's infrastructure is already operating at the limits of its heat and water resilience, while climate pressure will continue to grow. The current model of large-scale resort development is in direct physical and regulatory conflict with climate change.
The island should be stress-tested not simply as a ‘warm southern market’ but as an economy facing complex water, heat, wildfire and coastal risks. Assets tied to cheap water, the ‘sea–sun–beach’ model, wildfire-prone areas or low-lying coastlines should be priced to reflect substantial increases in the costs of adaptation, insurance and capital.
Successfully withstanding climate shocks requires a large-scale transformation of infrastructure (for more detail, see the global ‘Adaptation’ section). In Cyprus, as in many other countries, this process is lagging far behind the pace of warming, partly because of insufficient funding and delays in policy implementation:
Cyprus is highly vulnerable to climate risks. Natural conditions will deteriorate, adaptation is not guaranteed, and the market repricing of climate risks (see ‘The Coming Repricing’) may occur well before the physical changes, as awareness grows of the level of the threats, the scale of future impacts and the cascading risks. From this perspective, Cyprus's outlook may prove uncertain. Either tourist flows, which account for 20% of GDP, or investment may stop growing or begin to decline, and asset values may be repriced.
Under such a scenario, buying property and even making medium-term investments may already be substantially riskier, particularly compared with some other regions to which capital may begin to flow as ‘climate havens’.
Part 10
Industry vulnerability matrix · supply chains (diversification is no safeguard) · beneficiary sectors.
10.1 Vulnerability matrix
Each industry requires a separate assessment that takes account of where it operates and of global interconnections, but economies rest on ecosystem services — food, water, energy and raw materials — as well as on regulatory frameworks. The climate crisis hits each of these foundations and then transmits the damage to the financial system through lower profits, damaged collateral, higher credit risk and insurance payouts [IFoA, 2024IFoA — Climate Scorpion (2024)“nature as an asset that provides ecosystem services to society, such as the provision of raw materials for our economy, the provision of food and regulating services like climate regulation.”“ecosystem services… provide the essentials that society requires in terms of food, water, a stable climate, and so on.”; IFoA, 2023IFoA — Biodiversity and Nature-related Risks for Actuaries (2023)“ecosystem services… underpin our economies, societies, health and food systems”“Provisioning services are goods obtained from ecosystems such as food, raw materials, freshwater, energy and medicines.”; Zeidy, 2023Zeidy — Climate Related Risks to the Financial Sector (2023)“climate change can damage physical collateral”“severe weather events… reduce corporate profitability and potentially increase credit risk to lenders”“Severe climate change will lead to increased insurance claims and liabilities.”].
| Industry | Direct vulnerability | Financial risk |
|---|---|---|
| Agriculture | Lower crop yields due to drought, heat and floods; dependence on water (70% of global water withdrawals) | Inability to repay loans — a direct credit risk for banks with a large share of the agricultural sector in their portfolios |
| Fisheries and forestry | Decline or loss of the production base; fires | Loss of value in production assets and collateral |
| Real estate | Physical destruction of or damage to buildings due to fires, floods and hurricanes; land subsidence | Decline in the value of mortgage and commercial loan collateral — direct losses for banks |
| Construction | More stringent building requirements and standards; higher costs; fewer available sites | Higher costs as sales decline; pressure on margins |
| Transport and logistics | Destruction of ports, roads and airports; rivers drying up; disasters affecting transport routes | Supply chain disruption across all industries; higher costs |
| Insurance and reinsurance | A sharp rise in the number and size of insurance payouts | Insurer bankruptcies — a systemic risk because banks are major creditors of insurers |
| Heavy industry and manufacturing | Production stoppages due to physical damage, logistics disruptions or power outages; high water intensity (steel, pulp and food processing) | Lower profits; higher credit risk for banks |
| Energy | Power generation: extreme weather, overheating and water shortages for cooling thermal and nuclear power plants [IEAIEA — The world’s electricity systems must be ready to counter the growing climate threatWebsite]. Fossil fuels: transition risk and loss of value in oil, gas and coal assets [COMESACOMESA — Climate Change impact on the Financial SectorPDF]. | Asset write-downs on the balance sheets of banks and investment funds; greater risk of power-generation disruptions and higher infrastructure costs. |
| Tourism and recreation | Shifts in visitor flows; degradation of infrastructure and natural assets (beaches, reefs, forests and snow) | Declining asset returns and falling values of resort property |
Decarbonisation is highly uneven: emissions from power generation (Power) are falling sharply and transport emissions are stabilising, while emissions from heavy industry (steel, cement and chemicals) and agriculture/land use continue to rise or remain high [Rhodium, Climate Outlook, 2025]. This creates a dual risk for industry and agriculture:
Unlike energy and transport, agriculture has no clear technological solutions: decarbonising it may be the hardest challenge. Companies in renewable energy and electric-vehicle manufacturing are ‘on the right side of history’; heavy industry and agriculture are the primary source of future risk. The financial sector is already quantifying this: ‘dry’ events (drought and heat) cause the greatest productivity losses and the largest increases in default probabilities in agriculture and capital-intensive industries, while the energy supply sector suffers considerably from both ‘dry’ and ‘wet’ events [NGFS, Short-Term Scenarios, 2025].
10.2 Beneficiaries
The energy transition is the greatest opportunity for industrial growth since the Industrial Revolution [Boston Consulting Group, 2024]. It is a megatrend that will shape the economic landscape over the coming decades, whatever the short-term effects [S&P Global, 2025S&P Global — Credit FAQ: How the Global Climate Policy Pendulum Could Affect Our Ratings (2025)“climate transition is a megatrend … shape the economic landscape over the coming decades”]. Trillions of dollars are already being reallocated from sectors hurt by climate change to sectors that profit from it: the market rewards resilient business models and punishes vulnerable ones [Bloomberg, The Climate Economy Outlook, 2025].
| Beneficiary sector | Driver | Key metrics |
|---|---|---|
| AI infrastructure ABB, Schneider Electric, Delta | Rising data-centre energy consumption due to AI → demand for power and cooling solutions | Electricity demand for AI and industry will grow by ≈3% a year through 2030 (up from 0.5%); 36 «AI Enablers» outperformed the global IT index S&P 1200 by 11 pp over 3 years and by 17 pp over 5 years |
| HVAC — air conditioning Johnson Controls, Trane, Carrier | Record temperatures → demand for air conditioning and service contracts | Sector revenue is projected to rise from $70.9 billion (2024) to $94.8 billion by 2030 (≈+5% CAGR) |
| Prepare & Repair Jacobs, Stantec, equipment hire, DIY retail | Spending on disaster preparedness and recovery; vulnerability audits; new reporting standards | The 110-component index outperformed the S&P 500 by 4.5 pp over one year and by 9–12 pp over horizons of 3–10 years |
| Engineering and construction Strabag, AtkinsRéalis, Larsen & Toubro | Recovery programmes; flood-control projects | Orders for flood control and infrastructure reconstruction (Austria, Switzerland, Poland, Australia and Brazil) support revenue |
| Insurance brokers Arthur J. Gallagher, Aon | Rising insurance premiums due to climate risks | The main beneficiaries of rising risks are not insurers (which bear the losses) but brokers (which earn commission as turnover rises); they outperform the S&P 500 |
The Bloomberg ‘Prepare & Repair’ Index (BPRAET) brings together companies that benefit in two areas: ‘preparedness’ (adaptation — building products, risk management, consulting and storage) and ‘disaster recovery’ (HVAC, grid equipment, environmental services, insurance, engineering and emergency response). The ‘recovery economy’ has systematically outperformed the broad market over 3-, 5- and 10-year horizons [Bloomberg, 2025].
Context · water as infrastructureWater is an underappreciated driver of EU growth: water infrastructure faces an investment gap of hundreds of billions of euros, while inaction is already costing tens of billions a year. Key ‘industries of the future’ — semiconductors, data centres, ‘green’ hydrogen and batteries — are extremely water-intensive, and cannot grow unless water scarcity is addressed [WSP, Socio-economic study on the value of the EU investing in water].
Climate risks are creating durable tailwinds for five clusters that are delivering faster revenue growth and/or excess returns relative to the market. This is the core of the ‘climate alpha’ investment thesis — repricing cuts both ways (see Part VIII).
Final slide
Every additional fraction of a degree of warming increases climate risks [IPCC AR6 SYR, 2023IPCC AR6 Synthesis Report“Every increment of global warming will intensify multiple and concurrent hazards ... Risks and projected adverse impacts and related losses and damages from climate change escalate with every increment of global warming”Web]. Every action matters — whether it helps or harms the climate. Knowledge and practices spread through example, multiplying their impact.
11.01 Personal Responsibility and a Realistic Perspective
Global institutions are not yet managing the crisis effectively. Many politicians, meanwhile, have little incentive to adopt radical measures: voters dislike them, and governments worldwide have deep ties to the fossil-fuel industry and industrial agriculture. Moreover, no one bears real responsibility for the future.
Businesses and society also often focus on short-term gains or pay too little attention to the problem, relying on governments — creating a vicious circle. Yet when institutions fail, private initiative becomes essential at a systemic level.
Even if everyone begins the transition to clean energy and sustainable agriculture and industry today, serious challenges will still lie ahead. Postponing change until tomorrow or waiting for others to start tackling the problem means making the task virtually impossible.
Radical change is needed now — today, without delay. The later these changes take place and the more compromises are made, the greater the hardship and danger that await us and our children in the coming decades.
11.02 Systemic Solutions
Modern challenges demand a radical restructuring of core infrastructure and a rethinking of our very way of life. We invite specialists in relevant fields, engineers, and scientists from around the world to join forces on a nonprofit basis to develop initiatives such as “Clean Energy Cities” (CEC).
CEC is a global open-source project comprising a comprehensive set of operating protocols, principles, and specific technological solutions for creating a fundamentally new, sustainable living environment.
Cities account for approximately 70% of global greenhouse gas emissions and 67% of primary energy consumption; up to 70% of all food produced globally is destined for consumption in cities [IPCC AR6 WGIII, 2022IPCC AR6 WGIII — Summary for Policymakers“In 2020, urban emissions were estimated to be 29 GtCO2-eq (67–72% of the global share).”Web; UN-Habitat, 2024Urban Content of NDCs: 2024 Report“Cities are responsible for approximately 67 per cent of global primary energy consumption and 70 per cent of global greenhouse gas emissions.”Web; FAOFive ways to make cities healthier and more sustainable“People in urban areas consume up to 70 percent of global food supply.”Web]. However, experience shows that efforts to transform existing cities often encounter critical systemic barriers, making the process slower and more expensive than building from scratch. Moreover, maximum efficiency can be achieved only in new settlements whose architecture is designed from the outset around sustainable development goals. At the same time, many advanced solutions tested in such cities can subsequently serve as a foundation for modernizing traditional settlements.
The project’s objective is to develop an economically viable, open “franchise” of autonomous settlements with a closed-loop life-support system. The model will then be continuously scaled and refined through the adoption of innovations, in-depth analytics based on digital twins, and the open exchange of best practices among all members of the network.
To ensure flexible scaling and applicability across a wide variety of climatic conditions, we propose developing individual core modules of the system. These function as modular building blocks, allowing them to be combined in ways that account for the specific characteristics of particular regions, local needs, and available resources.
The technical solutions incorporated into CEC should become a new standard for modern living and a benchmark for the transformation of megacities:
Global adoption of this model will largely resolve the following issues:
A natural outcome of implementing these standards will be not only environmental protection and the mitigation of climate risks, but also a substantial increase in life expectancy and quality of life. This outcome will be achieved by eliminating systemic toxic factors from which reliable protection is virtually impossible today, even in the most exclusive districts of traditional megacities.
Many of the proposed technological solutions already exist and often prove more advantageous even from an economic standpoint, especially when used in environments designed around them from the outset. For example, solar panels can meet a significantly larger share of energy demand when installed on energy-efficient buildings designed according to passive architecture principles.
If the existing urban network were progressively replaced or modernized according to these standards, these crises would be largely resolved.
A potentially effective path to this goal is to initiate a natural large-scale movement of people. As traditional cities become increasingly vulnerable and dangerous, while environmental awareness and remote work become more widespread, healthy, autonomous, and safe Clean Energy Cities could become natural magnets for many people.
A brief overview of the other proposed initiatives can be found here. Their detailed descriptions will be provided in subsequent materials. We are also currently developing a new socioeconomic model, because effectively addressing global challenges extends beyond the material and technical domain and requires a comprehensive rethinking of every sphere of social life.
11.03 Practical Steps for Everyone
Investors, businesses and individuals need to act on two equally important fronts: reducing pressure on the climate (mitigation) and preparing for inevitable changes (adaptation). Hopes of a mild scenario are not being borne out — the world is heading towards a more extreme future.
These steps address the root cause of warming by reducing greenhouse gas emissions.
The impacts will intensify. It is vital to protect lives and capital.
These steps are equally important for preventing catastrophe and mitigating its impacts.
Take the initiative and spread the word. The wider public does not yet grasp the full scale and severity of the impacts of climate change. Your actions and personal example have a powerful network effect — this is how systemic change happens.
The report is continuously revised as new data and feedback become available. Our goal is to maintain a coherent, up-to-date picture of the world, rather than produce a document that quickly becomes outdated. We invite specialists to join this initiative as part of the IEvoH .
Last updated
The +2 °C and +3 °C cards in Map: Climate change thresholds were clarified: the timing of the temperature thresholds is now separated from descriptions of possible impacts, and the wording now reflects the probabilistic framing of the IFoA Planetary Solvency risk matrix.
Data from Bevacqua et al., Moderate global warming does not rule out extreme global climate outcomes (Nature, 2026), were added to Map → Food, Bad News → Impacts could be worse than expected, Wildfires → Future projections, and Floods → Future projections.
Data from Reuters, BBC, The Straits Times, DutchNews, EEA/JRC, and viadonau on the Danube were added to Map: Logistics Chains and Energy.
Material from the IEvoH White Paper was added to Solution → Comprehensive Solution.
IEvoH · Systems analysis
Our view of the root causes of this crisis is presented on the IEvoH website — an initiative to establish the Institute for the Evolution of Humanity.
Explore the root causesResearch collaboration
If you have research, data, or evidence-based comments that could strengthen or correct this report, please send them to our team.
Contact usIndependent scientific project
This report was produced independently, without a commercial objective or external funding. Your support helps us continue researching problems and searching for solutions.
Support our workContributions are not tax-deductible: the nonprofit organization has not yet been registered.